Abstract
The broiler sector in Turkey has advanced particularly in recent years. Hence, it has become one of the most crucial sub-sectors in the food industry, serving as a huge source of employment. Despite all these developments, land scarcity and energy capacity obstruct the procurement of input within the scope of the country. Therefore, certain substantial inputs needed by the poultry sector are provided by import. At this conjuncture, it is believed that the high cost of inputs and the external dependence on inputs have retarding effects on the sector’s progress. The aim of this study is to identify the spillover effect on prices of imported inputs (energy and soybean), which are widely used to determine broiler prices in Turkey’s broiler sector. In the research, the long-term correlation of monthly price data spanning the time period of 2003:1 and 2016:9 was analyzed as benefiting from VECM (Vector Error Correction Model). The findings, in the long term, the broiler prices increase by 2.60% in the face of 10% increase in energy prices, while it rises by 3.84% against a 10% increase in soybean prices. In addition to that, short-term one-way relation of causality from energy prices to soybean prices was determined. For the poultry sector, the results show that integrated strategic plans, including both energy and feed markets, must be designed.
DOI: 10.30682/nm1801d
Gokhan Cinar*, Berkay Keskin**
* Department of Agricultural Economics, Faculty of Agriculture, Adnan Menderes University, Aydın, Turkey.
** Department of Agricultural Economics, Faculty of Agriculture, Ankara University, Ankara, Turkey.
Corresponding author: gokhan.cinar@adu.edu.tr
1. Introduction
The demand shift from grain consumption to meat products has occurred along with income boost, due to the rapid economic growth. However, the high prices of red meat in Turkey pave the way for efforts to meet the animal protein deficit from broiler consumption.
However, the recent price increases in the broiler sector in Turkey have caused dramatic effects on the household budget. Broiler industrial enterprises explain the reason for the price increases with the high input costs in imports. In this sector, there are two important import inputs that can affect prices. The first one of these is soybean and the second one is energy. Particularly soy is an important input for the poultry sector, while energy is frequently used in product transportation, poultry heating and obtaining other agricultural inputs (fertilizers, chemicals). Recently, however, an increase in the production of corn and soy-based bio-fuels as an alternative to petroleum has started a second connection between energy and agriculture (Chen et al., 2010). This situation has created a different relationship between energy prices and the broiler sector, as well as revealing the shortage of the feed, which is the main ingredient of the broiler sector, due to constraints regarding the lands. In this context, this study has focused on the effects of these two imported inputs on the Turkish poultry sector.
There has recently been a strong connection, which continues when there’s escalation and reduction in the prices, between energy and agricultural commodity prices (Abbott et al., 2009). These connections have increased, particularly as the demand for food in developing countries has changed and the bio-fuel industry has grown (Reboredo, 2012). Government supports for increased bio-energy capacity has led to an increase in demand for corn and soybeans all over the world; however, it also caused increases in the prices (Tyner, 2010). This increase in the prices has also affected feed prices, which is the main input of animal breeding (Tejeda and Goodwin, 2009). This has led to problems in the procurement process in many different sectors of agriculture. These disruptions in the market have had a negative impact on the prosperity level of certain actors throughout the supply chain. This is why it is important to understand the policies established in the primary input markets. Because the input market may cause price volatility in products related to vertical chain (Buguk et al., 2003).
For the Turkish broiler industry, energy and soybean markets are important import inputs containing vertical connections. These inputs’ being import materials makes the price interventions more difficult. Therefore, the Turkish broiler sector is more vulnerable to the shocks in this market.
Understanding more clearly the input market and the integration of poultry industry would enable the improvement of more rational policies to producers, consumers, and food security in the sector which is so crucial for Turkey. Therefore, the aim of this research is to determine the spillover effect between energy, imported feedstuff, and chicken meat markets within the poultry sector which is so important for Turkey in many respects.
2. Literature
The price transmission makes it easy to understand whether there are defects in the market during the procurement process. If there has been a glitch throughout the supply chain, it will provide the indication of the stage in which this glitch in the market has been occurred. Thus, the way the product prices are transmitted throughout the marketing chain is traditionally a matter of concern (Bor et al., 2014; Guillen and Artés, 2015; Hahn et al., 2016). However, this issue has frequently been addressed within its aspect of the determination of the transmission between farmer-retailer-consumer prices (Ben-Kaabia, et al., 2005; Abbassi et al., 2012; Rezitis, 2012) instead of examining the right price transmission from the feed to the livestock market (Brümmer et al., 2009; De and Zhou, 2015).
Yet, feed costs constitute more than 60% of the total cost of livestock production (Lawrence et al., 2008). This cost is an important factor affecting both the demand for feed crops and livestock production. However, recent increases in the prices of feed crops have had negative effects on both producers and consumers. The increase in the prices of feed crops has been due to the combination of shocks related to supply and demand of these crops (Suh and Moss, 2017). Developed countries support energy policies that focus on environmentally friendly, renewable and cheap energy sources. This situation has increased the production of alternative energy sources and bio-fuels. This trend in energy policies has led farmers to reallocate their cultivable lands for the production of cereals and oilseeds used in bio-fuel production. However, the shortage of lands has caused restrictions in planting of feed crops. Bio-fuel programs and energy prices have narrowed the supply of the feed grains, as the feed grain demand has increased in the developing countries (Abbott et al., 2009). Thus, the increase in feed crop prices has become related to the instability in energy prices (Saghaian, 2010). Bio-energy policies have affected the livestock supply chain with its impact on the feed market (Bartoli et al., 2016). This problem shows that livestock, energy and feed market relations will become more complex and important in an ongoing basis.
|
Table 1- Foreign trade of soybean and poultry in Turkey, broiler consumption per capita. |
|||||
|
Year |
Consumption |
Soybean (USA dollar) |
Poultry (USA dollar) |
||
|
(kilogram/capita) |
Export |
Import |
Export |
Import |
|
|
2002 |
9.334 |
39508 |
139613537 |
14603596 |
8344649 |
|
2004 |
11.358 |
686658 |
226827629 |
21984970 |
7394710 |
|
2005 |
11.755 |
2583 |
328533229 |
37488640 |
8046392 |
|
2006 |
11.425 |
8796 |
264796633 |
28534511 |
8987619 |
|
2007 |
13.049 |
26887 |
409656078 |
46406383 |
8448680 |
|
2008 |
12.800 |
98138 |
647899927 |
89896105 |
16326897 |
|
2009 |
14.732 |
83745 |
429298527 |
164882876 |
15246162 |
|
2012 |
16.767 |
10724682 |
684803835 |
545283951 |
29940986 |
|
2013 |
16.153 |
12472290 |
642979347 |
633242687 |
19833579 |
|
2014 |
15.751 |
2029127 |
1119756202 |
687583633 |
19326525 |
|
2015 |
16.512 |
7128788 |
968176298 |
481246166 |
18455587 |
|
Source: Organisation for Economic Cooperation and Development (OECD) and Turkish Statistical Institute (TSI). |
The studies on broilers, which is a major livestock product in feed costs, until today, have determined that they have a significant impact on consumer prices (Babula et al., 1991; Rezitis and Stavropoulos, 2010; Erdem et al., 2011; Khiyavi et al., 2012). However, the connections of energy, feed and broiler markets are still unknown. Therefore, determining the level and the speed of the transmission between international energy and the soybean market and the Turkish broiler market will deepen the extent of the literature on this issue.
3. Perspective of the poultry sector in Turkey
Turkey is one of the top ten chicken producers in the world and also biggest producer among Mediterranean Countries (FAO, 2017). In Turkey, chicken meat consumption is in the first place accounting for 62% of the meat consumption. It is the most preferred among other kinds of meat. The total chicken meat production of 696.187 tons in 2002 rose to 1.909.276 tons in 2015 (TSI, 2016). While the chicken meat consumption per capita in Turkey was about 7.5 kg in 2005, it rose to 16.5 kg in 2015 (Table 1). The sector offers vast employment opportunities in Turkey. There are approximately 1.5 million families obtaining income from the poultry sector in Turkey. The sector, which exported only US$ 21 million 984 thousand in 2002, has increased this volume by US$ 687 million 583 thousand in 2014 (Table 1).
Turkey’s poultry sector has become one of the fastest-developing and the most powerful sector, coupled with the influence of subsidies. In spite of the positive developments in the sector, substantial matters still remain. The basic problems can be classified as stiff costs, external dependence on inputs and a decreased level of consumption with regard to developed countries (EU-28; 22.70 kg/per capita). The stiff cost is particularly one of the most critical problems hampering the growth of the sector. The researches executed in Turkey reveals that the feed expenditures comprise 70% of the sector’s costs (Sarıca et al., 2016). The most essential raw material used in poultry feed in Turkey, which is still procured majorly through import, is soybean. The amount of soybean cultivated in Turkey is not sufficient to meet the demand of the poultry sector. Hence, soybean is a fundamental raw material needed by the poultry sector in Turkey. The shortage of agricultural land in Turkey limits the possibility of having sufficient soybean, utilized in animal feeding, by home-grown production sources. In 2013, soybean valued at US$ 642.979 million was imported into Turkey (Table 1). Turkey is a net importer of this product. So, one of the basic raw materials used for feed making in the sector is obtained majorly by importation. Additionally, energy is the second substantial input utilized to fulfill the heating need in the poultry sector. In 2014, natural gas took the first place with its proportion being 32.5% within the primary energy demand of Turkey, as this product was followed by coal and oil at 29.2% and 28.5% respectively. While Turkey’s external dependency on oil reaches 75%, 23% of energy needs are used in the industrial sector (The Ministry of Energy, 2016). The procurement of fundamental inputs required by the sector, which are energy used for heating and soybean, may to a large extent help to further the sector’s external dependency. As a result, the developments at these markets may make Turkey’s poultry sector quite sensitive. It is likely that the poultry industry would be more price responsive as Turkey becomes more vulnerable to risks in the international markets. The abrupt fluctuation of input prices may result in problems with respect to inability to meet the following; the requirements of labor force and industries attached to this sector as well as the animal protein need in Turkey. Therefore, developments in this sector are important for the Turkish agricultural market.
4. Data and methods
4.1. Data
The data utilized in this research comprises of (on a monthly basis) world soybean prices, world energy price index, and domestic consumer chicken prices in Turkey, covering the period between January 2003 and September 2016. This period was selected on the basis of data availability. The US dollar is at an influential position over international agricultural commodity prices (McCalla, 2009). Therefore, the US dollar was used as the medium of exchange in this research. In the study, the substantial imported inputs generating basic costs in the poultry sector were taken into consideration. The most significant imported input in Turkey’s poultry sector is soybean. Heating, illumination, and transportation costs are other important input costs for production. The international price of soybean and world energy prices were obtained from the official website of IMF. The price of soybeans used in this study was for the number 2 yellow and par type subjected to future contract relating to Chicago’s Soybean. On the other hand, the energy price index (2005=100) is a general index acquired from Crude oil (petroleum), Natural Gas, and Coal Price Indices. Hence, this variable is a reflection of not only heating, but also of transmission and of other fuel costs. The chicken prices in Turkey were taken from the website of the Turkish Statistical Institute. The variables and definitions used in the research are given in Table 2.
In Figure 1, the data set utilized for the model is presented. With respect to it, the existence of high rate volatility in chicken prices since 2003 can be stated. Also chicken, soybean, and energy prices tend to decrease after 2013. The prices of these three variables have risen specifically in times of international financial crisis.
4.2. Methods
The researchers within price spillover have applied miscellaneous methods, such as Vector Error Correction Model (De and Koemle, 2015), Autoregressive Distributed Lag (Traoré and Badolo, 2016), threshold autoregressive (Balcombe et al., 2007), Generalized Autoregressive Conditional Heteroskedasticity (Fakari et al., 2016), cointegration with structural breaks (Lee and Chang, 2005) and causality tests (Nazlioglu and Soytas, 2011).
As stated earlier, the aim of this study is to identify the spillover effect on prices of imported inputs (energy and soybean), which are widely used to determine broiler prices in Turkey’s broiler sector. Given that the system requires real time management, which implies interchangeability among sources, then the presence of endogeneity among variables is anticipated. The use of the Vector Error Correction Model (VECM) proved to be adequate, considering both the presence of endogeneity among variables and the presence of cointegration relationships (Marques et al., 2014). Also and foremost, the characteristics of the data are one of the main determining factors in selecting the appropriate econometric techniques. Therefore, in this study, the VEC model was applied to examine the dynamics of imported input usage over the Turkish poultry sector.
|
Table 2 – Variable definitions. |
|||
|
Variables |
Definition |
Unit |
Source |
|
CMP |
Consumer chicken prices in Turkey |
US$ per kilogram |
TSI (Turkish statistical institute) |
|
Soybean |
U.S. Soybean price. Chicago Soybean futures contract |
US$ per metric ton |
IMF (International Monetary Fund) |
|
Energy |
Energy index, includes crude oil, |
2005=100 |
IMF(International Monetary Fund) |
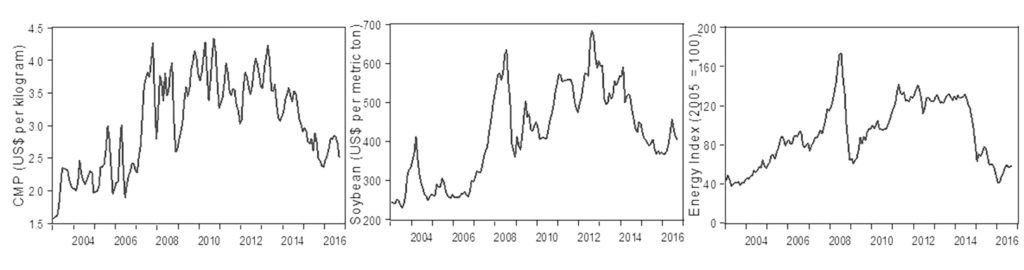
Figure 1 – The monthly consumer chicken prices, the soybean prices and the energy prices index (2004-2016).
The VEC model, which is used in this study, derived from the Vector Auto Regressive Model (VAR) can be defined with the equations below (Johansen, 1988, 1991; Johansen and Juselius, 1990).
Ct = β0+ β1Gt-1 +…+ βkAt-k + εt (1)
Where Ct=(CMPt, Soybeant, Energyt), β0 is a 3×1 vector of constants, β1 are 3×3 coefficient matrices, and εt are white noise residuals. Following the equation (1), the VECM equation can be written thus:
ΔCMPt= c + Gt-1 + β1ΔCMPt-1 + β2ΔSoybeant-1 + β3ΔEnergyt-1+ εt (2)
Where Gt = Rt (CMPt + ρSoybeant + δEnergyt + µt) shows a long-term equilibrium relationship between the three variables; c, α, β, ρ and δ are parameters to be estimated.
Differing from Granger causality tests in the VAR specification, the Granger causality test in an VECM can be divided into short- and long-run tests. The test for the coefficient restriction on the lagged first differenced terms is called short-run test, since the coefficients Bj’s of lagged variables ΔRt = j captures the short-run dynamics. In this case, the Wald x2(n) test is used to detect the Granger causal relation (Toda and Phillips, 1993). However, the test for the coefficient restriction on the error correction (EC) term is called long run test, since the EC term captures the long-run equilibrium between variables (Toda and Phillips, 1994; Enders, 1995).
In this study, the relationship between the variables was investigated both as long and short term with the method described above. Engle and Granger (1987) states that, by adding the term of error correction into the regression, immediate effects can be created between the variables. This immediate effect reflects the short term relationship. On the other hand, in the long-term, variables are sorted out from the effects of their previous values, and the system is identified with a defined by a process of balance. In science of economics, short term shows the sudden market shocks, where the firm balance production opportunities do not change; and the long term shows a period, in which both input and output prices are completely flexible in terms of production. Thus, long and short term structure, in accordance with the economic literature in terms of econometrics, will be obtained. Short and long term relationships may vary depending on the elasticity of the variables and the structure of the market.
|
Table 3 – Unit roots tests. |
||||||||
|
Augmented Dickey-Fuller test statistic |
Phillips-Perron test statistic |
|||||||
|
Intercept |
Trend and Intercept |
Intercept |
Trend and Intercept |
|||||
|
t-Statistic |
Prob.* |
t-Statistic |
Prob.* |
t-Statistic |
Prob.* |
t-Statistic |
Prob.* |
|
|
Log-CMPI(0) |
-2.837432 |
0.0553 |
-2.333420 |
0.4132 |
-2.792177 |
0.0616 |
-2.310288 |
0.4257 |
|
Log-Soybean I(0) |
-2.282046 |
0.1790 |
-2.432441 |
0.3615 |
-2.093793 |
0.2475 |
-2.105018 |
0.5388 |
|
Log-Energy I(0) |
-2.056702 |
0.2627 |
-1.741880 |
0.7281 |
-2.045021 |
0.2675 |
-1.557498 |
0.8054 |
|
Log-CMP I(1) |
-11.85600 |
0.0000* |
-12.01606 |
0.0000* |
-9.489695 |
0.0000* |
-12.32820 |
0.0000* |
|
Log-Soybean I(1) |
-8.707850 |
0.0000* |
-8.722264 |
0.0000* |
-8.739130 |
0.0000* |
-8.753910 |
0.0000* |
|
Log-Energy I(1) |
-8.640230 |
0.0000* |
-8.708309 |
0.0000* |
-8.733046 |
0.0000* |
-8.740127 |
0.0000* |
First of all, the stationarity level of data was identified in the study. To this end, the test statistics results obtained from the studies of Dickey and Fuller (1979) and Phillips and Peron (1988) were utilized. In these tests, the null hypothesis variables contain one unit root and are not stationary. In Table 3, it is seen that the variables are not stationary at the level value, as all variables whose first difference were taken becomes stationary. The first difference values of all variables I(1) are stationary with regard to two different test results. It is found that there can be a co-integrated relationship among all variables since all of them have the same stationarity level.
5. Results
The first step in the estimation of equation identified at Model equation 1 is the determination of the lag lengths. The interest criteria results of AIC are as follow: Akaike information criterion (AIC), Schwarz information criterion (SC) and Hannan-Quinn (HQ) were primarily taken into account for the determination of lag length. Yet, secondly, various diagnostic tests were conducted to check the stability of VAR model for these lags. The lag length of the model was identified as three (3) relying on the tests (Table 4).
|
Table 4 – VAR Lag Order Selection Criteria. |
||||||
|
Lag |
LogL |
LR |
FPE |
AIC |
SC |
HQ |
|
0 |
38.28873 |
NA |
0.000128 |
-0.446693 |
-0.388542 |
-0.423077 |
|
1 |
589.0809 |
1073.696 |
1.35e-07 |
-7.304822 |
-7.072220 |
-7.210359 |
|
2 |
630.3563 |
78.89354 |
8.97e-08 |
-7.713371 |
-7.306318* |
-7.548062* |
|
3 |
643.8335 |
25.24836 |
8.48e-08* |
-7.770044* |
-7.188539 |
-7.533888 |
|
4 |
648.1492 |
7.921228 |
9.00e-08 |
-7.710750 |
-6.954793 |
-7.403746 |
|
5 |
659.6147 |
20.60890* |
8.73e-08 |
-7.741959 |
-6.811550 |
-7.364108 |
|
6 |
668.4436 |
15.53434 |
8.76e-08 |
-7.739792 |
-6.634932 |
-7.291095 |
|
7 |
673.6071 |
8.889058 |
9.22e-08 |
-7.691229 |
-6.411917 |
-7.171684 |
|
8 |
677.5976 |
6.718171 |
9.85e-08 |
-7.627818 |
-6.174054 |
-7.037426 |
The presence of autocorrelation and heteroscedastic problems in the equation should be determined to fulfill the regression assumptions in the VAR model in which the lag length is 3. If explanatory variables were selected from a limited part of the universe or there is any structural problem, the heteroscedastic problem can arise. The existence of a heteroscedastic problem in this research was checked, benefiting from the white test. The null hypothesis cannot be rejected as a consequence of this test (Chi-sq 170.5955; p 0.0644). Accordingly, there is no heteroscedastic problem at a significance level of 0.05.
The inverse roots of AR characteristic polynomial were examined inside the unit circle in Figure 2. So, none of the modulus values are out of the reference interval. Non-appearance of any AR root outside the unit circle substantiates the probability of the VAR model’s stationarity.
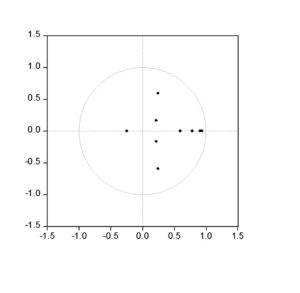
Figure 2 – Inserve roots AR characteristic polynomial.
The summary of Johansen’s co-integration test was presented in Table 5. Regarding the test findings, there is one co-integration. Also, the null hypothesis stating that there are two co-integrations is rejected, while the null hypothesis stating that there is one co-integrated vector cannot be rejected. The trace statistical data indicates the existence of one co-integrated vector. On the other hand, the values of Unrestricted Co-integration Rank Test (Maximum Eigenvalue) support the results obtained by trace statistical data. In accordance with Johansen’s co-integration test, there can be a long-run association between Log-CMP, Log-Energy, and Log-Soybean variables.
After the Johansen’s technique, the normalized long term co-integration relationships are presented in the model below.
Log-CMP= 2.41+ 0,260481 Log-Energy(0.09353) + 0,384356 Log-Soybean(0.11728)
The standard errors in the model equation were presented parenthetically. The signals in the normalized long term co-integration relationship are coherent as expected and the coefficients are significant at a significance level of 0.05 (tenergy–statistic= 2.78485; tsoybean–statistic= 3.027720). Furthermore, there is a long term positive correlation between chicken meat prices in Turkey as well as soybean and energy prices, which are imported inputs. The model’s logarithmic form enables one to interpret the estimated coefficients as the long-term elasticity. It can be asserted that the imported soya bean has greater impact on chicken meat prices. Hence, while the acquired coefficient for energy prices is 0.26, this ratio is 0.38 for soybean prices. These coefficients show that chicken meat prices increases by 2.60% in the face of the increase by 10% in energy prices. On the other hand, the soybean price increase by 10% leading to a rise in chicken meat prices by 3.84%. The impact of energy costs over the sector is slightly higher in equilibrium relationship than the expected one.
|
Table 5 – Results of Johansen’s cointegration tests. |
|||
|
Hypothesized No. of CE(s) |
Eigenvalue |
Trace Statistic |
Critical Value |
|
None * |
0.112332 |
33.00309 |
29.79707 |
|
At most 1 |
0.046783 |
13.69960 |
15.49471 |
|
At most 2 * |
0.035989 |
5.937743 |
3.841466 |
Table 6 displays the estimation results of the VEC model. These results show short-term effects. The statistical significance of error correction term coefficients is required for the existence of co-integration. The error correction term is statistically significant at a high degree for CMP. The absolute value of error correction statement which shows the necessary measures needed to adjust the disequilibrium arose within one month on the model. The error correction terms signal the stability of the system and the latter’s reach to equilibrium, following certain malfunctions. Specifically, the adjustment amount of disequilibrium within one month is about 13.95%. Based on that value, all of the system’s instability can be adjusted approximately in 7 months. The result obtained is statistically significant at a significance level of 0.05 (tECT = -2.487725; p = 0.0139).
The Wald test has been applied to each independent variable forming the lagged equation in Table 6 and the direction and significance of short-term relationships has been determined (Table 7). The possibility to interpret the short term causality applying the Wald test on the each parameter of the delay equation in the established models was determined. In accordance with it, any causality from international soybean and energy prices to chicken prices in Turkey could not been identified. It shows that the imported inputs have not short term effects on Turkey chicken meat consumer prices. Furthermore, any short term causality from chicken meat and soybean prices to energy prices could not been found. It is an expected result. The determinants of energy prices are mostly a reflection of macroeconomic problems. Likewise, any short term causality from Turkey chicken meat prices to world soybean prices could not been identified. It is an expected finding. The determinants of international soybean prices can be explained to large extent by the problems appeared at major importers and producers. The results demonstrate the causality from energy prices to international soybean prices. One of the substantial inputs used for every kind of agricultural product is the energy. Thus, energy price fluctuations may have effects on international soybean prices.
|
Table 6 – Estimated VEC model. |
|||
|
Error Correction: |
ΔLog- CMP |
ΔLog- Energy |
ΔLog- Soybean |
|
ECT |
-0.139562** |
0.077070 |
0.119208*** |
|
(0.05026) |
(0.05020) |
(0.04515) |
|
|
ΔLog-CMP(-1) |
0.492557*** |
0.061265 |
-0.051028 |
|
(0.08488) |
(0.08477) |
(0.07624) |
|
|
ΔLog-CMP(-2) |
-0.394289*** |
-0.113162 |
-0.101300 |
|
(0.08278) |
(0.08267) |
(0.07435) |
|
|
ΔLog-CMP(-3) |
0.092263 |
-0.030513 |
-0.015381 |
|
(0.08403) |
(0.08392) |
(0.07548) |
|
|
ΔLog-Energy(-1) |
-0.045636 |
0.256046*** |
-0.148538* |
|
(0.08634) |
(0.08623) |
(0.07755) |
|
|
ΔLog-Energy(-2) |
0.021464 |
0.099834 |
0.180165** |
|
(0.09124) |
(0.09112) |
(0.08195) |
|
|
ΔLog-Energy(-3) |
0.015842 |
-0.060504 |
-0.106266 |
|
(0.08524) |
(0.08513) |
(0.07657) |
|
|
ΔLog- |
0.127381 |
0.133597 |
0.452444*** |
|
(0.09281) |
(0.09269) |
(0.08336) |
|
|
ΔLog- |
0.033482 |
0.065152 |
-0.030269 |
|
(0.10032) |
(0.10019) |
(0.09010) |
|
|
ΔLog- |
0.108605 |
0.126644 |
-0.016461 |
|
(0.09406) |
(0.09393) |
(0.08448) |
|
|
C |
0.000572 |
0.002430 |
0.002446 |
|
R-squared |
0.333162 |
0.200381 |
0.215777 |
|
F-statistic |
7.544180*** |
3.783990*** |
4.154719*** |
On the other hand, energy has affected the prices of soybean and chicken meat in the long term, however, no effect has been detected for the short term. Supply elasticity of agricultural products has generally been low in short term. Especially the chicken meat quickly becomes deteriorated and is a product that cannot be preserved. It must be sold including the whole stock within a certain period from the time it is produced. In this period, the price should be determined in a way that fits the demand. Therefore, in the short run, the role of producers and costs is often limited when determining the prices. In addition, competition in the Turkish broiler sector, and accordingly, the effort to prevent losing the market, hinders the short-term reflection of the costs to the prices. Firms may compensate these costs from their profits for a certain period of time. Thus, not being able to determine the short-term relationships in the poultry sector is a possible outcome, despite the significant relationship that is found with the input prices in the long-term.
|
Table 7 – Short run causality Block Exogeneity Wald Test Results. |
|||
|
Hypothesized |
Test Statistic |
Value |
Probability |
|
Soybean prices ‡ Chicken meat prices |
F-statistic Chi-square |
1.692831 5.078493 |
0.1710 0.1661 |
|
Energy prices ‡ Chicken meat prices |
F-statistic Chi-square |
0.121615 0.364845 |
0.9473 0.9474 |
|
Energy prices ‡ Soybean prices |
F-statistic Chi-square |
2.864810 8.594429 |
0.0387** 0.0352** |
|
Chicken meat prices ‡ Soybean prices |
F-statistic Chi-square |
1.021614 3.064843 |
0.3849 0.3817 |
|
Chicken meat prices ‡ Energy prices |
F-statistic Chi-square |
1.045748 3.137245 |
0.3742 0.3709 |
|
Soybean prices ‡ Energy prices |
F-statistic Chi-square |
1.338653 4.015958 |
0.2640 0.2597 |
6. Discussion and Conclusion
In general, analyses suggest that chicken meat prices are in equilibrium relationship with energy and soybean prices, which are the imported inputs. However, findings have shown that price increases in energy costs affect broiler prices in the long term. The effect is somewhat higher than the energy product interaction found in some previous studies. For instance, Sarıca et al. (2016) have revealed that electricity, transportation and other expenses constitute a small part of the broiler production costs. This finding contradicts with this study. There are two reasons for this. The first is the participation of the energy market as an input in the poultry sector, and the second is the relationship with the agricultural markets and the feed market as a result of the bio energy policies. Another important finding of the study is the determination of the continuous and unidirectional relationships of causality that range from energy prices to soybean prices. This finding supports previous studies (Nazlioglu, 2011; Reboredo, 2012). The feedback from energy to agricultural markets leads to a closer link from oil prices to soybeans prices due to the fact that soybeans are the main crops used in the production of ethanol and biofuels.
Nevertheless, it turns out that energy and soybean prices do not affect chicken prices in the short term. This can be attributed to the fact that the production of agricultural products that are used as animal feeds is carried out in a long production period. This finding coincides with the studies done for China pork market (De and Koemle, 2015). Additionally, the system instability over chicken meat and input costs can be adjusted in approximately 7 months. This state is a consequence of the huge competitive environment, the short production term related to the product, and the shortness of supply chain in Turkey’s poultry industry.
In recent times, an increasing trend in the demand for chicken meat has led to swift changes in the Turkish poultry sector. Turkey has gained more grounds in terms of factors such as the growing of modern plants, engaging the production methods relevant to international standards, and the proximity to international markets. Yet, the modernization in production and the sector’s development have intensified its dependency on imported input.
In this context, with this study, it has been determined that importing inputs such as soybean and energy, which are used in broiler sector, reduces the power of competition of the sector. In fact, in local studies, the problems of the poultry sector are generally linked to the feed costs (Keskin and Demirbaş, 2012). However, the most important result obtained from this study is that the energy prices affect both soybean and chicken prices more. The results show that the increase in energy prices observed in recent years might have been transferred to the poultry and feed sector. This information shows that the Turkish poultry industry is not capable of protecting itself against world energy shocks.
The increase in attractiveness of bio-fuel production due to environment friendly energy policies will further strengthen the link between energy and feed markets. Therefore, the ongoing support policies for bio-fuel production may further affect poultry and livestock prices in the future terms. In this respect, designing robust livestock and energy policies requires the definition of the mechanism of transmission between energy and feed prices. Therefore, the local measures that aim suppressing the uncertainty of price in soy markets in Turkey may not be effective in the short term. The results show that it is necessary to design integrated strategic plans for both energy and feed sector. For any policy aimed at price stability on livestock, this reality should be taken into account. For this reason, policy makers should target energy prices while supporting the feed prices.
In addition, the results of this study clearly show that not only policy makers, but also producers and merchants should attach importance to global feed and energy prices. Because, the agricultural input producers will focus on the profitability of the product, when they decide on producing for fuel or for people (Zhang et al., 2010). This will increase the price volatility between products together with the connection between substitution and competing agricultural products in the future, due to the constraints regarding the lands.
Further researches might be extremely valuable for the determinants of price volatility and its impact on information transfer between markets in future researches. The increase in agricultural prices may depend on the level of the relationship between energy and feed prices. In this context, the literature should be able to expand the effects of energy and financial markets on agricultural markets without defining them separately.
References
Abbassi A., Tamini L.D. and Gervais J.P., 2012. Do inventories have an impact on price transmission? Evidence from the Canadian chicken industry. Agribusiness, 28(2): 173-186.
Abbott P.C., Hurt C. and Tyner W.E., 2009. What’s driving food prices? March 2009 Update (No. 48495). Farm Foundation.
Babula R.A., Bessler D.A. and Schluter G.E., 1991. Corn/broiler price transmissions and structural change since the 1950s. Agribusiness, 7(3): 269-284.
Balcombe K., Bailey A. and Brooks J., 2007. Threshold effects in price transmission: the case of Brazilian wheat, maize, and soya prices. American Journal of Agricultural Economics, 89(2): 308-323.
Bartoli A., Cavicchioli D., Kremmydas D., Rozakis S. and Olper A., 2016. The impact of different energy policy options on feedstock price and land demand for maize silage: The case of biogas in Lombardy. Energy Policy, 96: 351-363.
Ben Kaabia M., Gil J.M. and Ameur M., 2005. Vertical integration and non-linear price adjustments: The Spanish poultry sector. Agribusiness, 21(2): 253-271.
Bor O., Ismihan M. and Bayaner A., 2014. Asymmetry in farm-retail price transmission in the Turkish fluid milk market. New Medit: Mediterranean journal of economics, agriculture and environment. 13(2): 2-8.
Brümmer B., Von Cramon-Taubadel S. and Zorya S., 2009. The impact of market and policy instability on price transmission between wheat and flour in Ukraine. European Review of Agricultural Economics, 36(2): 203-230.
Buguk C., Hudson D. and Hanson D., 2003. Price volatility in agricultural markets: An examination of U.S. catfish markets. Journal of Agricultural and Resource Economics, 28(1): 86-99.
Chen S.T., Kuo H.I. and Chen C.C., 2010. Modeling the relationship between the oil price and global food prices. Applied Energy, 87(8): 2517-2525.
De Z.H.O.U. and Koemle D., 2015. Price transmission in hog and feed markets of China. Journal of Integrative Agriculture, 14(6): 1122-1129.
Dickey D.A. and Fuller W.A., 1979. Distribution of the estimators for autoregressive time series with a unit root. Journal of American Statistical Society, 75: 427-431.
Enders W., 1995. Applied Econometric Time Series. New York, USA: Wiley, 211, 243-251, 376-377.
Engle R.F. and Granger C.W., 1987. Co-integration and error correction: representation, estimation, and testing. Econometrica: Journal of the Econometric Society, 55(2): 251-276.
Erdem C., Şentürk İ., Karkacıer O. and Şimşek T., 2011. An Examination of Price Behavior in Turkish Broiler Markets. The Empirical Economics Letters, 10(6): 575-582.
Fakari B., Aliabadi M.M.F., Mahmoudi H. and Kojori M., 2016. Volatility Spillover and Price Shocks in Iran’s Meat Market. Custos e Agronegocio On Line, 12(2): 84-98.
Food and Agriculture Organization of the United Nations (FAO), 2017. FAOSTAT, http://www.fao.org/faostat/en/#home (accessed 05 April 2017).
Guillen J. and Artés R.F., 2015. Price transmission and volatility along the Spanish fresh fish market chain. New Medit, 14(1): 4-11.
Hahn W., Stewart H., Blayney D.P. and Davis C.G., 2016. Modeling price transmission between farm and retail prices: a soft switches approach. Agricultural Economics.
International Monetary Fund (IMF), www.imf.org/external/np/res/commod/external_data.xls (accessed 12 November 2016).
Johansen S., 1988. Statistical analysis of cointegration vectors. Journal of Economic Dynamics and Control, 12: 231-254.
Johansen S., 1991. Estimation and hypothesis testing of cointegration vectors in Gaussian vector autoregressive models. Econometrica, 59: 1551-1580.
Johansen S. and Juselius K., 1990. Maximum likelihood estimation and inferences on co-integration with application to the demand for Money. Oxford Bulletin of Economics and Statistics, 52: 169-210.
Keskin B. and Demirbas N., 2012. Türkiye’de Kanatlı Eti Sektöründe Ortaya Çıkan Gelişmeler: Sorunlar ve Öneriler. Uludağ Üniversitesi Ziraat Fakültesi Dergisi, 26(1): 117-130.
Khiyavi P.K., Moghaddasi R., Eskandarpur B. and Mousavi N., 2012. Spillover effects of agricultural products price volatilities in Iran. Journal of Basic and Applied Scientific Research, 2(8): 7906-7914.
Lawrence J., Mintert J., Anderson J.D. and Anderson D.P., 2008. Feed grains and livestock: Impacts on meat supplies and prices. Choices, 23(2): 11-15.
Lee C.C. and Chang C.P., 2005. Structural breaks, energy consumption, and economic growth revisited: evidence from Taiwan. Energy Economics, 27(6): 857-872.
Marques A.C., Fuinhas J.A. and Menegaki A.N., 2014. Interactions between electricity generation sources and economic activity in Greece: A VECM approach. Applied Energy, 132: 34-46.
McCalla A.F., 2009. World food prices: Causes and consequences. Canadian Journal of Agricultural Economics/Revue canadienne d’agroeconomie, 57(1): 23-34.
Nazlioglu S., 2011. World oil and agricultural commodity prices: Evidence from nonlinear causality. Energy policy, 39(5): 2935-2943.
Nazlioglu S. and Soytas U., 2011. World oil prices and agricultural commodity prices: evidence from an emerging market. Energy Economics, 33(3): 488-496.
Organisation for Economic Co-operation and Development (OECD) https://data.oecd.org/agroutput/meat-consumption.htm (accessed 12 November 2016).
Phillips P. and Perron P., 1988. Testing for a unit root in time series regressions. Biometrica, 75: 335-346.
Reboredo J.C., 2012. Do food and oil prices co-move? Energy Policy, 49: 456-467.
Republic of Turkey Ministry of Energy and Natural Resurces. http://www.enerji.gov.tr/en-US/Mainpage (accessed 12 November 2016).
Rezitis A.N., 2012. Modelling and decomposing price volatility in the Greek meat market. International Journal of Computational Economics and Econometrics, 2(3-4): 197-222.
Rezitis A.N. and Stavropoulos K.S., 2010. Supply response and price volatility in the Greek broiler market. Agribusiness, 26(1): 25-48.
Saghaian S.H., 2010, The Impact of the oil sector on commodity prices: correlation or causation? Journal of Agricultural and Applied Economics, 42 (3): 477-485.
Sarıca M., Ceyhan V., Uçar A. and Boz M., 2016. Comparison of Slow Growing Synthetic Broiler Genotypes with Commercial Broilers in Terms of Growth, Carcass Traits and Some Economic Parameters. Tarım Bilimleri Dergisi, 22(1): 20-31.
Suh D.H. and Moss C.B., 2017. Decompositions of corn price effects: implications for feed grain demand and livestock supply. Agricultural Economics.
Toda H. and Phillips P., 1993. Vector autoregressions and causality. Econometrica, 61 (6): 1367-1394.
Toda H. and Phillips P., 1994. Vector autoregression and causality: a theoretical overview and simulation study. Econometric Reviews, 13(2): 259-285.
Tejeda H.A. and Goodwin B.K., 2009. Price volatility, nonlinearity, and asymmetric adjustments in corn, soybean, and cattle markets: Implications of ethanol-driven (market) shocks. In 2009 Conference, April 20-21, 2009, St. Louis, Missouri (No. 53039). NCCC-134 Conference on Applied Commodity Price Analysis, Forecasting, and Market Risk Management.
Traoré F. and Badolo F., 2016. On the co-movement between coffee and cocoa prices in international markets. Applied Economics, 48(40): 3877-3886.
Turkish Statistical Institute (TSI), http://www.tuik.gov.tr/PreTablo.do?alt_id=1014, (accessed 12 November 2016).
The Ministry of Energy, http://www.enerji.gov.tr/en-US/Mainpage, (accessed 14 November 2016).
Tyner W.E., 2010. The integration of energy and agricultural markets. Agricultural Economics, 41(s1): 193-201.
Zhang Z., Lohr L., Escalante C. and Wetzstein M., 2010. Food versus fuel: What do prices tell us? Energy Policy, 38(1): 445-451.