Abstract
In Turkey, studies investigating the economic effects of climate change on agriculture are limited and there is little or no research that focuses on livestock production as regards changes in climate. In this context, the main objective of this research is to analyze the impacts of climate change on dairy cattle farms in terms of costs, according to different future scenarios and farms scales. Interviews were conducted with 140 dairy farmers in Thrace Region. To analyze the change in costs, the model developed by Calil et al. (2012) was used. According to the results of cost analysis, it was determined that climate change will lead to a 10-50% cost increase on dairy farms by the year 2044. The heat stress is responsible for 48-71% of the increase in the cost of production, where 24-52% is due to an increase in feed prices. Based on the outcome of this research, it was suggested that agricultural extension activities should be carried out in order for farms to get adapted to climate change. Agricultural supports and investment projects should be related to climate change.
DOI: 10.30682/nm1903c
Gökçe Koç*, Ayse Uzmay*
* Department of Agricultural Economics, Faculty of Agriculture, Ege University, Bornova, Izmir, Turkey.
Corresponding author: gkc_add@hotmail.com
Cite this Item: Koç G., Uzmay A., The effect of climate change on the cost of dairy farms in Turkey; Case study of Thrace Region, New Medit, 18 (3): pp. 31-46, http://dx.doi.org/10.30682/nm1903c
1. Introduction
Presently, the effects of climate change on livestock production are one of the recurrent issues being discussed. Climate change increases the running cost of farms due to several reasons, such as reduced yields, rising cost of treatment, increasing prices of feed and energy and making new infrastructure investments to redesign of the barns such as building cooling, evaporating, watering, fogger systems, sprinklers and fans.
Dairy cattle are more vulnerable to changes in climatic factors than other ruminants and could be swiftly influenced by them (Bernabucci et al., 2010). These effects comprise; (1) yield and quality-reducing effects on milk production, (2) effects on growth; reduction in both feed intake, feed efficiency and body weight, (3) effects on reproduction; (4) hormonal changes in adapting to climate change, (5) proliferation of diseases or spring up of new ones (Sejian et al., 2016). The issues caused by climate change and the resulting heat stress could cause significant economic problems to dairy farms (Bajagai, 2011; Henry et al., 2012; Sejian et al., 2015; Sinha et al., 2017). Besides, the impact of climate change on yield of feed crop is also a considerable reason for the cost increase (Calil et al., 2012; Lakew, 2017). Furthermore, there are other reasons which may increase the cost of the farmers such as making new investments to apply climate-smart agricultural practices and technological transfer for mitigating the effects of climate change (Branca et al., 2015; Alrusheidat et al., 2016).
An internationally accepted temperature-humidity index (THI) has been established to investigate the effects of climate variables on dairy cattle (Bernabucci et al., 2014; Sinha et al., 2017). THI can be calculated using ambient temperature and relative humidity. It is widely accepted in the international literature that THI=72 is the starting point of stress in dairy cattle, thereafter, milk yield, fat and protein content starts to decrease (Du Preez et al., 1990; Armstrong, 1994; Ravagnolo and Misztal, 2000; Bouraoui et al., 2002; West et al., 2003; Chase, 2006; Bernabucci et al., 2014; Sinha et al., 2017). Some studies also claimed that this threshold is lower for high producing dairy cattle (Armstrong, 1994; Berman, 2005; Collier et al., 2012; Gantner et al., 2015). The yield losses calculated by the researchers as a result of the increase in THI; 0.18-0.36lt/day for Poland (THI>72), 0.41 lt/day for Tunisia (THI>69), 0.2 lt/day for the US (THI>72), 0.24-0.716 lt/day (THI from 68 to 76) for Croatia (Ravagnolo and Misztal, 2000; Bouraoui et al., 2002; Herbut and Angrecka, 2012; Gantner et al., 2015). In the United States of America, a total loss of $ 2.36 billion/year due to heat stress has been estimated from the livestock sector and dairy production loss took the highest share (St-Pierre et al., 2003). Another study also conducted in the same country reported that economic losses from heat stress were $ 670 million per year in the historical period (1950-1999), $ 1.7 billion per year in the 2050s, and $ 2.2 billion per year in the 2080s (Mauger et al., 2015). Key et al. (2014) estimated a decrease in the total value of milk production in the US by $ 198.6 million in 2030. According to the result of the study by Calil et al. (2012), the operational costs of US dairy farms will increase in 2050 between 2.7% and 15.1% due to climate change. Cortignani et al. (2015) stated that climate change would reduce the net income of Italian dairy farms by 2.1% till 2030. In Australia, the output of dairy farms is expected to decline by 5-15% across the country by 2050 and the economic loss would be about $ 100 million/year (Hanslow et al., 2014). In Africa, a continent mostly affected by climate change, it was reported that climate change would cause $ 177,351.24 revenue loss by the end of the mid-century (Lakew, 2017).
Most of the studies that examined climate change in Turkey generally focused on the economy and crop production (Cakmak et al., 2009; Dellal et al., 2011; Aksoy and Can, 2012; Sen et al., 2012; Dudu and Cakmak, 2017; Dumrul and Kilicaslan, 2017; Ouraich et al., 2018). There are also rare studies examining the effects of climate change and heat stress on livestock production, especially on dairy cattle (Yaslıoğlu and İlhan, 2016; Işık et al., 2016). Although, there are no studies that analyzed the issue from the point of cost of dairy farming. Nevertheless, according to scenarios of Intergovernmental Panel on Climate Change (IPCC) and studies that examined the vulnerability and variability of the Mediterranean basin to climate change, the basin is one of the most adversely affected by climate change in the future (Silkin, 2014; IPCC, 2014; Turp et al., 2015). Thus, Turkey, where located in the Mediterranean basin, is one of the vulnerable country that will be affected by climate change and might face warmer, drier, and uncertain rain conditions (Dellal et al., 2011; Özdoğan, 2011; Kapluhan, 2013; Başoğlu, 2014). In this context, this research has two main aims; one is to analyze the effects of climate change on the costs of dairy farms in the Thrace Region. The second one is to bring proposals in terms of agricultural policies.
2. Research Methodology
2.1. The Study Area
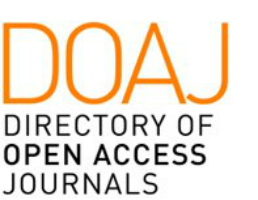
Thrace Region is located in the west of Turkey and in the Continent of Europe (Figure 1). It covers an area of about 1.9 million ha and consists of three provinces; Tekirdağ (TR211), Edirne (TR212), and Kırklareli (TR213). The Region covers the Meriç-Ergene Basin, which accounts for 77% (14.560 km2) of the total land.
In 2017, the total number of cattle in the region was 433926 head and 41.13% of them were the dairy cows. Milk production is 670833 ton/year (TurkStat, 2018). Thrace Region is one of the most important regions for Turkey’s dairy farming. According to the country’s milk yield ranking, provinces of the region are at the top position; Tekirdağ 4th, Kırklareli 5th and Edirne 7th (TurkStat, 2014). The region is also important due to its freedom from diseases. The disease-free zone is ensured through vaccination since 2010, particularly for the foot-and-mouth disease (Ministry of Food, Agriculture and Livestock, 2017a; EU, 2018). A total of 178 of 419 disease free dairy farms and 18 of 95 EU certified dairy farms are in Kırklareli (Esen, 2017; Ministry of Food, Agriculture and Livestock, 2017b). Furthermore, agro-industry is well developed in the region and there are 192 enterprises in the milk and dairy industry. Their annual dairy processing capacity is 351625 ton in Edirne, 312447 ton in Kırklareli and 405146 ton in Tekirdağ (TDA, 2015). The region’s closeness to important markets such as İstanbul and Europe increases its opportunities for marketing (Ministry of Food, Agriculture and Livestock, 2017b).
2.2. Meteorological Data
The mean annual temperature of Meriç-Ergene Basin is 13.4°C over the period, 1970-2000. The region’s climate is mid-rainy and the distribution of precipitation is geographically similar within the basins (Ministry of Environment and Forestry, 2008). According to the Turkish State Meteorological Service (TSMS), the Köppen–Geiger climate class of the region is hot-summer Mediterranean climate (Csa) (TSMS, 2016). As per the map of average humidity distribution in Turkey, the region’s humidity rate is between 70.6% and 78.3% (TSMS, 2017a).
According to the projections based on HadGEM2-ES model, RCP4.5 and RCP8.5 scenarios, average temperatures in the basin will increase between 1.7-1.8°C by 2015-2044, 2.4-3.1°C by 2045-2074 and 2.9-4.8°C by 2075-2100. Within the period 2015-2044, forecasts show that the greatest temperature rise would be by June (2-2.2°C), July (1.9-2.8°C), August (1.9-2.4°C) and September (1.9-2.6°C). Furthermore, it is also expected that the number of sequential droughty days will increase from 64 to 80 (Ministry of Forestry and Water Affairs, 2017).
The increment level of CO2 used in the study are taken from scenarios of Intergovernmental Panel on Climate Change (IPCC). CO2 concentration level was 399.97 ppm in 2015. By 2044, it is expected to rise between 471-508 ppm according to RCP 4.5 and RCP 8.5 scenarios, respectively (IPCC, 2017).
2.3. Methods of sampling and data collection
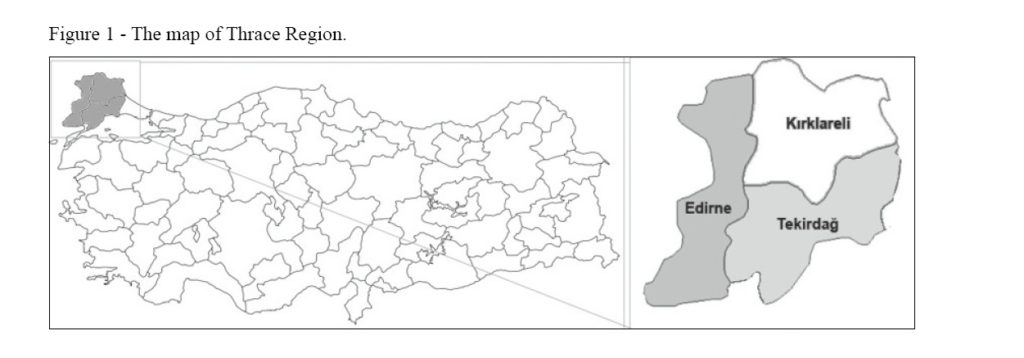
The main material used in this research is based on face-to-face interviews with dairy farmers in villages and districts of Edirne, Kırklareli and Tekirdağ in Thrace Region. The number of farmers to be included within the scope of the study was calculated as 140 according to the proportional sampling method (90% confidence interval, 6.9% error margin) (Newbold, 1995). In equation 1, n is the sample size, N is the population size (35214), and p is the prediction rate. Maximum sample size was aimed to be achieved in the study, where p: 0.50 and (1-p): 0.50 were taken.
The number of producers included in the survey from the provinces was determined according to the share of the total milk production. Thus, 53 farmers from the Edirne (Keşan and Uzunköprü districts), 45 farmers from the Kırklareli (Lüleburgaz and Babaeski districts) and 42 farmers from the Tekirdağ (Malkara and Hayrabolu districts) were included in the sample. These districts have 46.6% of the dairy farms and produce 45% of the whole milk in the region.
The farms included in the scope of the survey are farms which have more than 5 dairy cattle and registered in the genealogical registry. When the data was being analyzed, the farms were grouped into five groups depending on their sizes, that is, the number of dairy cows on the farm. The survey was conducted in August 2017. The questionnaire used for data collection is made up of two parts. The first section includes 13 farmers’ oriented demographic questions such as age, level of study and income. The second part consists of 103 questions about the general characteristics of the farms and 90 of them are open-ended. The context of these questions focused on information about the farm’s land size, animal existence, production pattern, variable costs (feed, labor, electricity, water etc.) and milk production.
2.4. Methods of data analysis
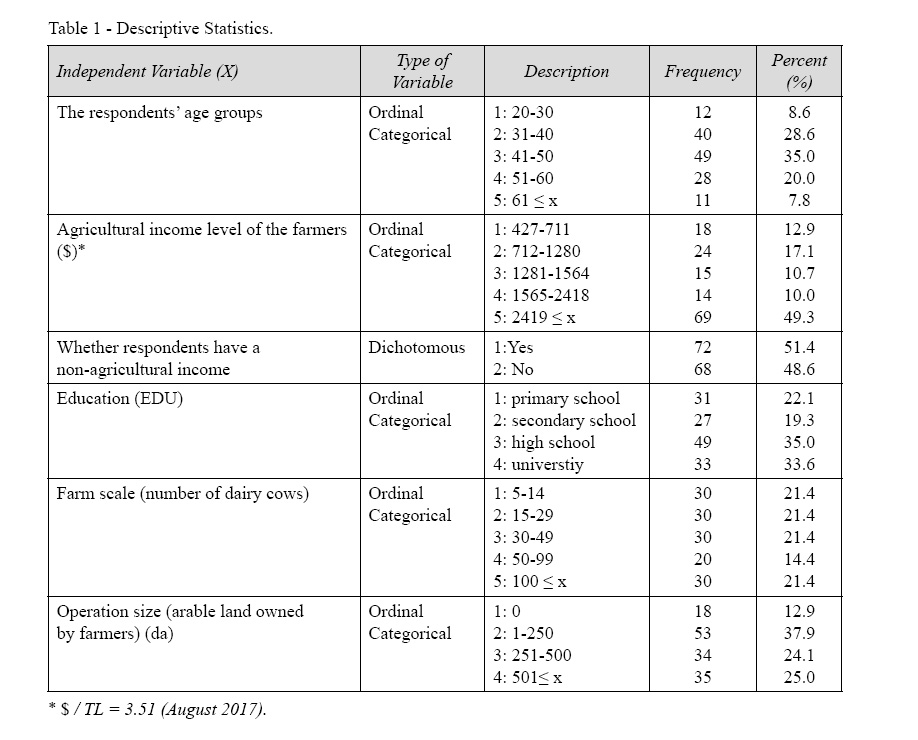
Information received from farmers was firstly assessed and evaluated by simple statistical methods such as frequencies, averages, and ratios. Farms were grouped into scale and classified in terms of the number of dairy cows; 1) 5-14, 2) 15-29, 3) 30-49, 4) 50-99, 5) 100 and above (see Table 1). In order to examine the difference between groups, Pearson Chi-Square analysis, Kruskal Wallis and Mann Whitney U tests were used. Data were analyzed using the Statistical Product and Service Solution (SPSS) software version 20.0 and Microsoft Excel.
2.4.1. Variable Costs
When calculating the variable costs of the farms, feed costs are first of all taken into consideration. Feed costs were divided into two parts which represent homegrown feed cost and purchased feed cost. Homegrown feed costs include seeds, fertilizers, pesticide, fuel, water, insurance, harvest, temporary worker costs and other inputs which are directly associated with feed crops production. Other variable costs of farms are electricity, water, veterinary services and medicines, artificial insemination, cleaning, transportation, insurance and temporary workers. Variable costs for each farm scale group were calculated separately.
2.4.2. Climate change effects of variable costs
In this study, the model developed by Calil et al. (2012) was used to determine the effects of climate change on dairy farms. Three different scenarios have been created to set out the impacts of climate change on total variable costs of farms. The terms “low, medium and high” were used for denominating these scenarios.
To estimate the increase in variable costs of dairy farms due to climate change, a model was constructed that include feed, energy costs and heat stress factor. Some key criteria were used for selecting correct inputs for the model; (1) input must constitute a large portion of a dairy farm’s budget, (2) must be directly affected by climate change, (3) must be measurable. In this context, due to their share of livestock ration and also their contribution to the variable costs, alfalfa, barley, corn, corn silage were selected to use in the model. Furthermore, the other important inputs used in the analysis are fuel, electricity and temperature which are related to climate change and cost of the farms.
2.4.2.1. Heat Stress Factor
There is also a need to calculate the effects of THI on milk yield in this model (MPD). The following equation was used to calculate the effects of heat stress on milk yield (Berry et al., 1964; Calil et al., 2012). On the equation; MPD is the absolute decline in milk production, (lt/cow/day), NL is normal daily production levels (lt/cow) and THI is temperature humidity index.

Based on previous studies, the THI threshold for the influence of heat stress on milk yield was 72 (Du Preez et al., 1990; Armstrong, 1994; Bouraoui et al., 2002; West et al., 2003; Chase, 2006; Broucek, 2007; Bernabucci et al., 2014; Sinha et al., 2017). When THI index ranges from 72 to 79, the cows begin to suffer from mild heat stress. If the THI exceeds 80, it means that there will be moderate heat stress (Armstrong, 1994; Akyuz et al., 2010; TSMS, 2017b). In this study, the THI level was taken as 72 (no stress) in the low scenario, 77 (mild stress) in the medium scenario and 80 (high stress) in the high scenario. In this case, it is assumed that heat stress will be zero and it does not have any effects on costs at the low scenario. In order to calculate the effect of heat stress on milk yield, this equation was repeated for the 5 farm scale groups each and 3 scenarios.
2.4.2.2. Feed Costs
The changes in total feed costs were calculated separately as homegrown and purchased feed costs. In order to determine the changes in crop prices, it was necessary to establish a relationship between yield, quantity and price. So, elasticity has been used to calculate how changes in the yield will affect the price of feeds (change in price = change in yield/elasticity of supply).
Lobell and Field (2007) reported that increasing 1°C of temperature led to decrease in barley yield by 8.9% and corn yield by 8.3%. Studies that analyzed the effects of climate change on alfalfa is limited (Calil et al., 2012). The effect of climate change on alfalfa production is directly related to the variety of seed, the availability of water, and the duration of dormancy. Lee et al. (2009) found that yield of alfalfa will increase by 3.7-3.8% in California. Another study from Uzbekistan claimed that yields will increase by 2-9% within the same period (Hunink and Droogers, 2011). In this study, it was assumed that the yield of alfalfa will not change in the low scenario, will increase by 2% in the middle scenario and by 4% in the high scenario.
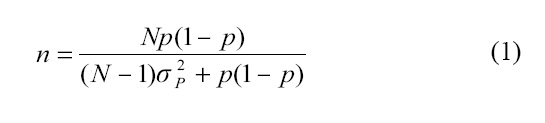
The supply elasticity of barley and corn was calculated by Tansel (1994) (TEPGE, 2017) as 0.21 and 0.47 respectively. There was no calculated elasticity for alfalfa. Alfalfa is a perennial crop that can be harvested several times in a year and can be used either as hay or silage. These factors make it difficult to estimate elasticity. When international literature is examined, it was observed that the alfalfa supply elasticities are different. For example, Knapp and Konyar (1991) calculated the supply elasticity of alfalfa for California as 0.41 on the short-term and 0.61 for long-term. Another study conducted in the USA have estimated the elasticity as 0.44 (Russo et al., 2008; Merel et al., 2013). Paggi (2011) stated that the supply elasticity for alfalfa ranged from 0.33 to 0.66. In this context, this research assumed that supply elasticity of alfalfa in Turkey is 0.5. In agreement with Calil’s model, the supply elasticity of silage is assumed to be the same as grain maize because the supply elasticity for silage feeds are not calculated. The following equation was used to calculate the change in purchased feed costs:
FBCb = % change in purchased feed costs
Ca, Cas, Cc, Ccs = % of alfalfa, barley, corn and corn silage in the total daily diet in region
FPna, FPnas, FPnc ve FPncs = national change in alfalfa, barley, corn and corn silage price
The producer price of these crops taken from TurkStat (2017) and recalculated in dollars. During the period of 1994-2016, barley prices increased by 126.93% and corn prices by 49.9%. The data of alfalfa is available for only the period of 2011-2016 and prices decreased by 6.07%. The quantitative shares of these four products in the ration were determined separately according to the farm scale groups. Then, the increase in purchased feed cost was estimated for each farm scale.
The changes in the homegrown feed cost was calculated as follows:
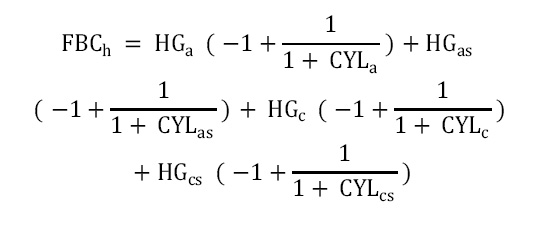
FBCh = % Increase in home grown feed cost
HGa , HGas, HGc, HGcs = % of alfalfa, barley, corn and corn silage in total home grown cost
CYLa,CYLas,CYLc, CYLcs = alfalfa, barley, corn and corn silage yield loss in region
The share of these four products in the homegrown feed cost was determined separately according to the farm scale groups. Subsequently, the equation was repeated considering the changing yield losses in each scenario.
When all these equations are put together, the total change in feed cost was calculated using the following equation:
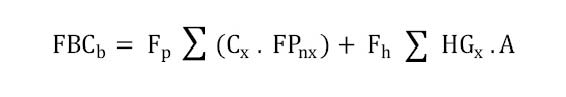
FBCb = % increase in feed cost
Fp = % of feed purchased
Fh = % of feed homegrown
Cx = % of composition of crop x in purchased budget
HGx = % of composition of crop x in homegrown budget
FPnx = National change in crop x price
A = Region X change in homegrown unit price
2.4.2.3. Energy Costs
The change in energy costs is a function of both increase in fuel and electricity prices. It has been formulated as follows:

Ec = % change in energy cost
Wfc = Fuel weight
FCC = Fuel cost change
Wec = Electricity weight
ECC = Electricity cost change
The share of fuel and electricity in total energy cost is ca. 50%. Other studies have also found that the share of fuel and electricity costs in total energy costs is equal (Talim et al., 2000). Calil’s model also assumes that fuel and electricity costs are equal and unchanged in the low scenario. Furthermore, Calil’s model agreed that electricity prices would increase by 3% in the medium and high scenarios as cited Amato et al. (2005).
In this study, it is assumed that electricity prices will increase by 3% due to climate change in medium and high scenarios. Turkey is foreign-dependent in terms of fuel. It was assumed that increase in fuel prices will be 15% in the medium scenario and 83% in the high scenario (Calil et al., 2012). The model of Calil et al. (2012) assumed that farmers could not implement any adaptation strategies to reduce the effect of heat stress by the use of fans and sprinklers.
2.4.2.4. Climate change effects on total overall costs of dairy farms
When all these changes are put together, the overall equation is stated below. This equation analyses the effects of changing feed costs, changing energy costs, and heat stress on the total costs of the dairy farms.
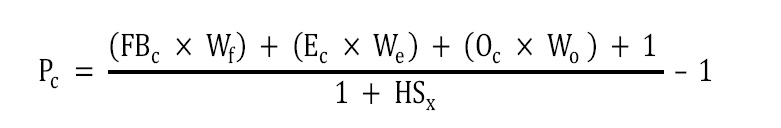
Pc = % Change in Operational Costs
FBc= Total feed budget change
Wf = % of Feed budget in total budget
Ec = Total energy budget change
We = % of energy budget in total budget
Oc = Total overhead budget change
Wo = % of overhead budget in total budget
HSx = Heat Stress for region
It was accepted that other costs will not change due to climate change in this study. This equation was repeated for each farm scale group and for the three scenarios each.
3. Results and Discussions
3.1. Characteristics of Farmers
Distribution of respondents’ socio-demographic characteristics are shown in Table 1. All the farmers who participated in the study are male and 82.9% of them are married. Their average age is 45 ± 11 years, their average agricultural experience is 19 ± 12 years and duration of dairy farming activity is 18 ± 12 years. These results are similar with those obtained from other regions of Turkey (Yılmaz, 2010; Gündüz and Dağdeviren, 2011; Uzmay, 2017). Almost all of the farmers’ (88.6%) main source of income are from farming-related sources. The share of livestock and plant production in agricultural income is 76% and 24%, respectively. A study conducted in İzmir also revealed that the share of dairy farming in agricultural income is 75% (Uzmay, 2017). The mean monthly income of 30% of the farmers is below $1280, while 20.7% of them earn in the range of $1281-2418 and 49.3% earn more than $2418. The results of the study also revealed that half of the respondents (51.4%) also earn income from non-agricultural sources. Regarding their educational backgrounds, 22.1% have primary education, 19% have secondary education, and 35% of them have high school degree. These results show that the education level of the farmers in this region is higher than the others (Elmaz et al., 2010; Demir and Aral, 2009; Yılmaz, 2010).
3.2. Farm characteristics
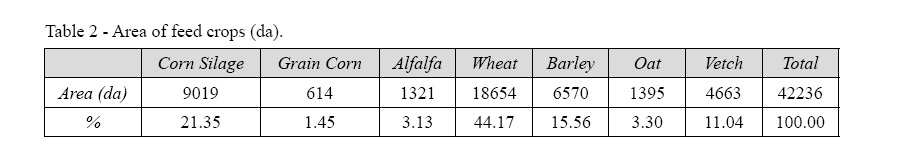
About 82.9% of the farms are into plant and livestock production. The total cultivated agricultural area is 61,974 decare and the farms’ average size is 442.67 decare. The majority of the land (68.15%) is used for growing feed crops. The share of wheat and silage corn area is 44.17% and 21.3%, respectively (Table 2). Moreover, the percentage of feed crops produced by various farms are as follows: 65% corn silage, 67% wheat, 60% barley, 50% sunflower, 31% vetch, 30% alfalfa, 15% oat, and 6% grain corn.
The scale of the farms is at least 5 and at most 1050 dairy cow. The number of milking cow is maximum 900. The annual production of milk is minimum 30 and maximum 9840 tones. The daily milk yield is minimum 18lt, maximum 40lt and the farms’ average yield is 23.39 ± 5.83 lt/day. There is a significant relationship between farm scale and milk yield (Kruskal-Wallis, p 0.000<0.05). The price of milk is $ 0.33 ± 0.26 per liter and the significant relationship was found between farm scale and selling price (Kruskal-Wallis, p 0.000<0.05). A total of 47.1% of the produced milk is sold to the cooperatives, 51.5% is sold to the modern factory, and the remaining are directly marketed.
3.2.1. Livestock ration
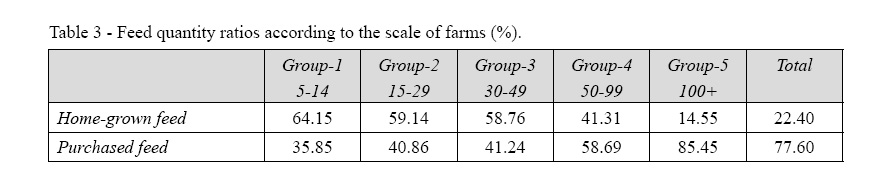
The total amount of feed is divided into two groups which represent homegrown feed and the purchased feed. Farmers purchase 77.6% of the total feed (by weight). This ratio is 35.85% and 85.45% for smallest and largest farm scale groups, respectively (Table 3).
A total of 32% of the used feed is concentrated and 68% is coarse fodder. The most commonly used feeds by weight are silage (43.47%), wheat straw (13.87%) and alfalfa (8.27%). The share of concentrated feeds is 22.74% factory produced feed, 2.20% pulps and 0.9% wheat bran. Corn (2.28%) and barley (2.15%) are foregrounds in grain feeds.
The farmers purchase 94.14% of the corn they use, 84.62% of the alfalfa, 70.83% of the corn silage and 70.77% of the straw. Almost all the used vetch (96.98%) and wheat (88.87%) are produced in the farms.
3.2.2. Variable costs
The highest share of the variable cost is feed costs (82.50%). Another study conducted in Thrace Region by Keskin ve Dellal (2011) also reported that the share of feed costs is 86.3%. Other studies from different provinces of Turkey demonstrated that the share of feed cost in total operating cost is 71.34% in Çanakkale province which is located in North Aegean, 69.82% in Samsun province (Blacksea Region), 89.35% in Adana (Mediterranean Region) and 86% in Kayseri province (Center Anatolia) (Şahin, 2001; Aktürk et al., 2010; Yılmaz, 2010; Gündüz ve Dağdeviren, 2011). This ratio is about 56% in the USA, 50% at EU, 31% at New Zealand, 40% at Netherlands, 35% for Germany, 12% at Lithuania (EU 2015; CDFA, 2016; DairyNz, 2017; Gołaś, 2017). It was respectively followed by veterinary and medicines (3.06%), animal insurances (2.83%) and electricity (2.35%).
The share of purchased feed in the total feed cost is 94.44%. This percentage is 93-99% in Malta and Spain, 67-69% in Sweden, Finland and Hungary (Gołaś, 2017). The most important ones for purchased feed cost are factory produced feed (65.51%), silage corn (13.92%) and alfalfa (7.74%). On the other hand, silage corn (37.61%), wheat straw (17.53%), barley (12.20%) and alfalfa (5.37%) have a salient share in the homegrown feed costs.
3.3. Model Results for Climate Change Impacts on Dairy Farms
3.3.1. Heat Stress Factor
For the first 4 farm scale groups, where there are no significant difference between milk yields, the heat stress factor was calculated to be about 12% in the medium scenario and 13.40% for large farms. Heat stress factor was varied between 19% and 21% in high scenario.
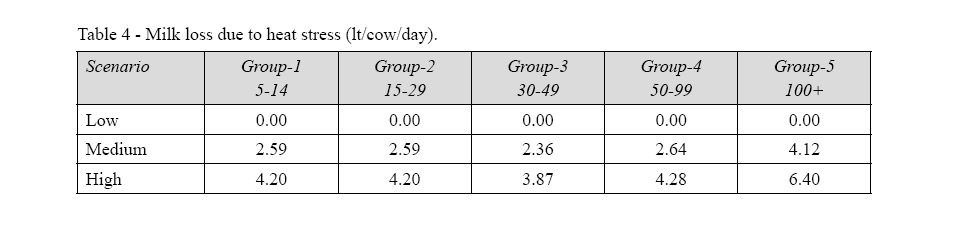
The milk loss due to heat stress was estimated to be 2.59 lt/day for smallest and 4.12 lt/day for largest groups (Table 4). In 2044, the daily earnings will decrease to 0.77-1.49 $/cow due to these losses in production. In the high scenario, heat stress will cause a loss of 3.87-6.40 lt/cow and 1.26-2.31 $/cow daily. A study conducted by Yaslıoğlu and İlhan (2016) also stated that heat stress led to 2.07-2.18 lt/day loss between 2007 and 2014 in some provinces near the Thrace Region. Lakew (2017) found that the daily milk yield will decrease by 3.62-4.00 lt/cow due to climate change in South Africa using the same climate model. St. Pierre et al. (2003) reported that the loss of yield per cow due to heat stress varied by region and reached an average of 2007 lt/year in the USA. Bauman et al. (2012) calculated that yields per-cow decreased by 0.12-3.43 lt/day for the historical period (1950-1999) and it would continue to decrease till 6.19 lt/day by 2050.
3.3.2. Change in feed price
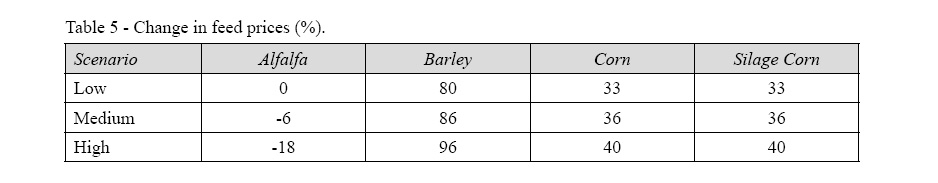
As for three different scenarios for 2044, the expected yield losses ranged from 15.13-17.80% for barley and 14.11-16.60% for maize. The results of a study carried out by Dellal et al. (2011), which uses different variables such as temperature, precipitation, evaporation and genetics, estimated that corn and barley yield of Turkey by 2050 will decrease to 10.1% and 7.6% owing to climate change. It is noteworthy that Marmara Region, which includes Thrace Region, is one of the most important region in terms of yield loss. Turkey’s production of barley declined by 22% as a result of 2007 drought (Engindeniz and Öztürk, 2009). Georgopoulou et al. (2017) reported that corn and barley yield will decrease by 10% and 2.7% respectively due to climate change in Eastern Macedonia and Thrace regions of Greece within the period 2021-2050.
It was estimated in this research that the highest price increase will be at barley due to decline in yields by 2044. However, the price of alfalfa is expected to decline. It was also stated in the United States that alfalfa prices will not change in the low scenario, but 4% and 8% decrease will be seen in the middle and high scenario (Calil et al., 2012). Table 5 shows the expected change in feed prices for plants that are used in the model.
3.3.3. Increase in purchased feed cost
The price increase in purchased feed cost per farm scales is shown in Table 6 and it ranges from 24% to 26%.

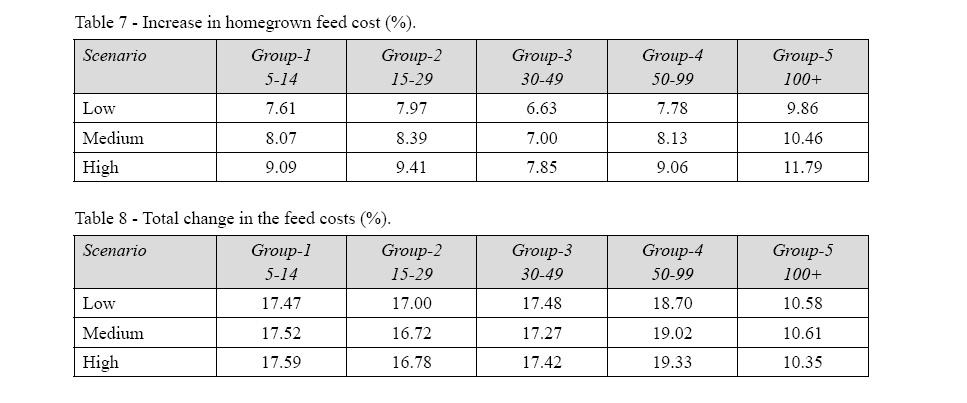
3.3.4. Increase in homegrown feed cost
The increase in homegrown feed cost for per scale and scenario is shown in Table 7. It is noteworthy that the highest cost increase will be experienced in the largest farm scale group.
3.3.5. Total change in the feed costs
It has been determined in this study that the total feed costs of the farms in the first four groups will increase by 16-19%. The largest group will face only 10% price increase (Table 8). This is due to the fact that in the largest group of farms the share of home-grown feeds is only 15%. The cost increase in the low scenario was calculated to be higher than in the high scenario for some scale groups. This is based on the assumption that alfalfa prices will not change in the low scenario but will decrease by 18% in the high scenario. The share of homegrown or purchased feed is different for each group.
3.4. Change in energy cost
It was calculated in this study that energy costs would increase by 9% in the middle scenario and by 43% in the high scenario (See the material and method section for details).
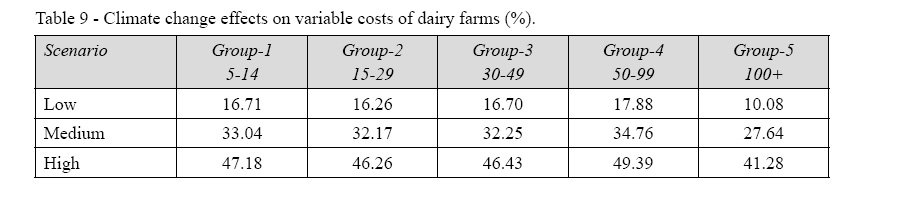
3.5. Total change in variable costs of farms
By the year 2044, the average increase in variable costs due to climate change are expected to be about 10-18% in the low scenario, 27-34% in the medium scenario and 41-49% in the high scenario (Table 9). Climate change will significantly affect variable costs even in low scenarios where the heat stress factor is not effective. In the low scenario, the cost increase would affect at most the 4th and at least the 5th group. In the middle scenario, it is noteworthy that the cost increase is usually doubled owing to the heat stress factor, or even about tripled in the largest group.
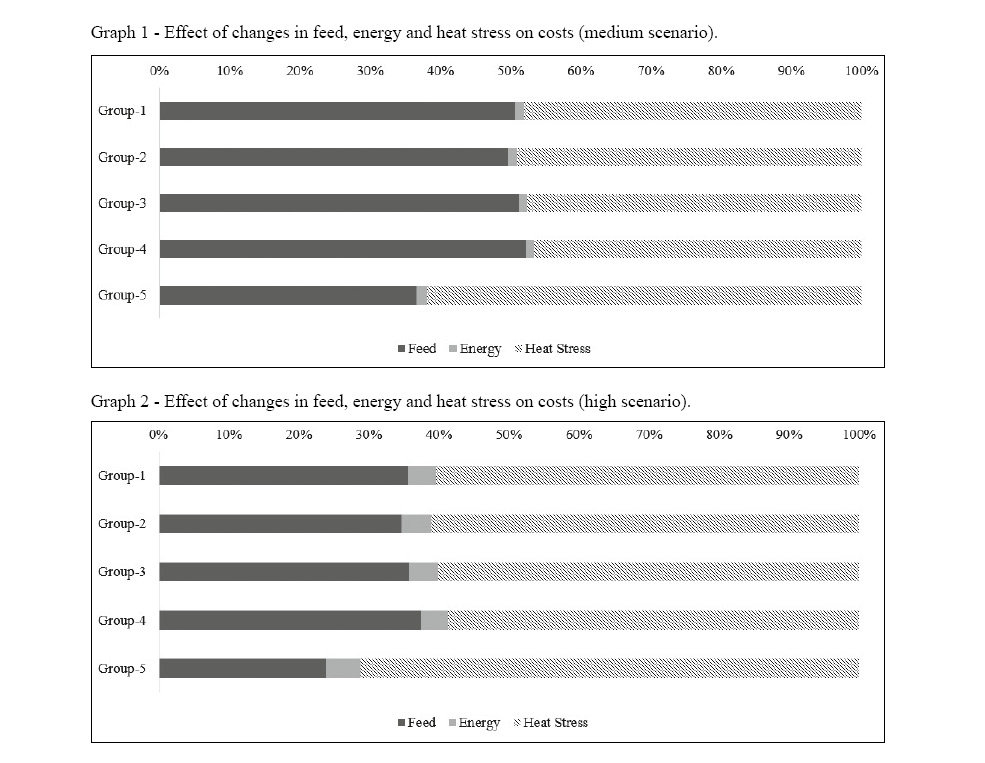
The findings of this study showed that the most dominant causes of the cost increase are feed costs and heat stress factor. Averagely, 51% of the cost increase in the first four groups is due to feed costs, 47.8% from heat stress and 1.2% from energy costs. The effect of feed costs is only 36% in the largest group. It is remarkable that heat stress factor is responsible for 61.9% of the cost increase in the largest group (Graph 1). The same results were also identified in the study conducted by Calil et al. (2012); heat stress and feed prices were equally affected by the total cost increase, and energy had a minimal effect.
In the high scenario, it was observed that the effect of the heat stress factor on variable costs increased to an average of 60% for the first four groups. This ratio is 71.2% in the largest scale group (Graph 2). In some regions of the USA, it has been stated that the effect of the heat stress factor on total costs is 80% (Calil et al., 2012).
4. Conclusions
In this study, the impact of climate change on variable costs of dairy farms was investigated based on different future scenarios and farm scales. The main findings of this study was that climate change will significantly increase the variable costs in dairy farms in the Thrace Region until 2044. The effects of climate change vary according to the scale of the farms and the temperature scenarios.
For the low scenario, it was assumed that there is no heat stress, milk yield loss and change in energy cost due to climate change. Nevertheless, if the average temperature increase by 1.7°C, the feed costs of the farm will be increased by 10-18%. The results of the medium scenario showed that total variable costs of the farms will increase by 27-35% due to climate change. Heat stress factor and feed price increase contributed to the cost increment half-and-half. According to the high scenario, it was observed that climate change will cause 41-49% cost increase in dairy farms. It is noteworthy that the heat stress has a share of up to 70% in the cost increase. The results of three different scenarios showed that the costs of the small and medium scale farms will increase by 17-50% due to climate change, while large-scale farms will increase by 10-41%.
According to the results of the survey, it is necessary to take precautions in order to minimize the effects of climate change on costs. There are some useful adaptation methods used to mitigate the effects of climate change on dairy farms; making infrastructural investments such as build cooling and watering systems, changing feeding practices seasonally, using supplementary nutrients and planting shade trees. In this context, extension activities for proper adaptation of the farmers is of vital importance. Moreover, new investment projects that take climate change into consideration should be supported in the region and the subsidies given to dairy farmers must be associated with climate change.
It is crucial to establish the farm accounting system and improve the statistical infrastructure so that the economic impacts of climate change on farms can be defined exactly and completely. Farm accountancy data network project is required to be put into practice. The inadequate research that examines the economic effects of climate change in dairy farms also prevents cross-regional comparisons. Ensuring awareness of all stakeholders in the sector on climate change and conducting multidisciplinary research about this issue will ensure that the technical and economic impacts of climate change are understood and necessary precautions are taken.
Acknowledgements
This study is supported by Ege University Scientific Research Projects Coordination Unit (Project Number: 2016-ZRF-054).
References
- Aksoy U., Can H.Z., 2012. Expected effects of climate change on organic agriculture in Turkey. New Medit, 11(4): 3-10.
- Aktürk D., Bayramoğlu Z., Savran F., Tatlıdil F.F., 2010. The factors affecting milk production and milk production cost: Çanakkale case-Biga. Journal of the Faculty of Veterinary Medicine, Kafkas University, 16(2): 329-335.
- Akyuz A., Boyaci S., Cayli A., 2010. Determination of critical period for dairy cows using temperature humidity index. Journal of Animal and Veterinary Advances, 9(13): 1824-1827.
- Alrusheidat J., Abu Hammour W., Aljaafreh S., 2016. Climate change adaptation and technology transfer: the path to disaster risk reduction in the arid and semi-arid zones, The case of Jordan. New Medit, 15(1): 2-6.
- Amato A.D., Ruth M., Kirshen P., Horwitz J., 2005. Regional energy demand responses to climate change: methodology and application to the commonwealth of Massachusetts. Climatic Change, 71(1): 175-201.
- Armstrong D., 1994. Heat stress interaction with shade and cooling. Journal of Dairy Science, 77(7): 2044-2050.
- Başoğlu A., 2014. The economic effects of global climate change, Sosyal Bilimler Dergisi, Vol. 7: 175-196.
- Bauman Y., Salathé Jr E.P., Mauger G.S., Nennich T.D., 2012. Impacts of Climate Change on Milk Production in the United States, http://www.standupeconomist.com/wp-content/uploads/2012/07/Milk_Draft_20120717.pdf (accessed: 10 April 2016).
- Berman A., 2005. Estimates of heat stress relief needs for Holstein dairy cows. Journal of Animal Science, 83(6): 1377-1384.
- Bernabucci U., Biffani S., Buggiotti L., Vitali A., Lacetera N., Nardone A., 2014. The effects of heat stress in Italian Holstein dairy cattle. Journal of Dairy Science, 97(1): 471-486.
- Bernabucci U., Lacetera N., Baumgard L.H., Rhoads R.P., Ronchi B., Nardone A., 2010. Metabolic and hormonal acclimation to heat stress in domesticated ruminants. Animal, 4(7): 1167-1183.
- Berry I.L., Shanklin M.D., Johnson H.D., 1964. Dairy shelter design based on milk production decline as affected by temperature and humidity. Transactions of the ASAE, 7(3): 329-333.
- Bouraoui R., Lahmar M., Majdoub A., Djemali M.N., Belyea R., 2002. The relationship of temperature-humidity index with milk production of dairy cows in a Mediterranean climate. Animal Research, 51(6): 479-491.
- Branca G., Lipper L., Sorrentino A., 2015. Cost-effectiveness of climate-related agricultural investments in developing countries: a case study. New Medit, 14(2): 4-12.
- Broucek J., Ryba S., Mihina S., Uhrincat M., Kisac P., 2007. Impact of thermal-humidity index on milk yield under conditions of different dairy management. Journal of Animal and Feed Sciences, 16(3): 329-344.
- Cakmak E., Dudu H., Saracoglu S., 2009. Climate change and agriculture in Turkey: A CGE modeling approach, Anadolu International Conference in Economics, June 17-19 2009, Eskişehir, pp. 24.
- California Department of Food and Agriculture (CDFA), 2016. Cost of Milk Production 2016 Annual, California, pp. 27.
- Calil J., Silvester A., Stelzl K., Wissel-Tyson C., 2012. The Effect of Climate Change on the Production Costs of the Dairy Industry in the United States, Bren School of Environmental Science and Management, University of California, Santa Barbara, pp. 68.
- Chase L.E., 2006. Climate change impacts on dairy cattle, Fact sheet, Climate Change and Agriculture: Promoting Practical and Profitable Responses, pp. 17-23.
- Collier R.J., Hall L.W., Rungruang S., Zimbleman R.B., 2012. Quantifying heat stress and its impact on metabolism and performance. Proceedings of the Florida Ruminant Nutrition Symposium, Vol. 2012: 74-83.
- Cortignani R., Dell Unto D., Acutis M., Lacetera N., Pasqui M., Roggero P.P, Dono G., 2015. The economic impact of changes in climate variability on milk production in the area of Grana Padano, FACCE MACSUR Reports, Vol. 5, pp. 5-18.
- DairyNZ, 2017. Economic Survey 2015-16, Hamilton, New Zealand, pp. 67.
- Dellal İ., McCarl B.A., Butt T., 2011. The economic assessment of climate change on Turkish agriculture. Journal of Environmental Protection and Ecology, 12(1): 376-385.
- Demir P., Aral S., 2009. The faced problems and solution proposals of dairy farms in Kars province. Journal of Turkish Veterinary Medical Society, 80(3): 17-22.
- Du Preez J.H., Hattingh P.J., Giesecke W.H., Eisenberg B.E., 1990. Heat stress in dairy cattle and other livestock under Southern African conditions, III. Monthly temperature-humidity index mean values and their significance in the performance of dairy cattle. The Onderstepoort Journal of Veterinary Research, 57(1): 77-87.
- Dudu H., Çakmak E.H., 2017. Climate change and agriculture: an integrated approach to evaluate economy-wide effects for Turkey. Climate and Development, 10(3): 275-288.
- Dumrul Y., Kilicaslan Z., 2017. Economic impacts of climate change on agriculture: empirical evidence from ardl approach for Turkey. Journal of Business Economics and Finance, 6(4): 336-347.
- Elmaz Ö., Saatcı M., Metin M.Ö., Sipahi C., 2010. Dairy Cattle in Burdur Province and Their Traits, Burdur, pp. 92.
- Engindeniz S., Öztürk G., 2010. Proposed measures for Turkish agriculture towards climatic change, 9. Tarım Ekonomisi Kongresi, 22-24 September 2010, Şanlıurfa, Vol. 2, pp. 956-963.
- Esen A., 2017. Kırklareli İli Lüleburgaz İlçesi Büyükbaş Damızlık İşletmelerinin Analizi. MSc Thesis, Namık Kemal University, pp. 48.
- European Union (EU), 2015. Overview of the Agricultural Inputs Sector in the EU, Policy Department B: Structural and Cohesion Policies, Brussels, pp. 122.
- Gantner V., Mijić P., Kuterovac K., Barać Z., Potočnik K, 2015. Heat stress and milk production in the first parity Holsteins–threshold determination in eastern Croatia. Poljoprivreda, 21(1): 97-100.
- Georgopoulou E., Mirasgedis S., Sarafidis Y., Vitaliotou M., Lalas D.P., Theloudis I., Giannoulaki K.D., Dimopoulos D., Zavras V., 2017. Climate change impacts and adaptation options for the Greek agriculture in 2021-2050: A monetary assessment. Climate Risk Management, 16: 164-182.
- Gołaś Z., 2017. Determinants of Milk Production Profitability of Dairy Farms in the EU Member States. Problems of Agricultural Economics, 3(352): 19-40.
- Gündüz O., Dağdeviren M., 2011. Determination of Production Cost of Cow Milk and Functional Analysis of Factors Affecting Milk Production in the Bafra District. Yuzuncu Yıl University Journal of Agricultural Sciences, 21(2): 104-111.
- Hanslow K., Gunasekera D., Cullen B., Newth D., 2014. Economic impacts of climate change on the Australian dairy sector. Australian Journal of Agricultural and Resource Economics, 58(1): 60-77.
- Henry B., Charmley E., Eckard R., Gaughan J.B., Hegarty R., 2012. Livestock production in a changing climate: adaptation and mitigation research in Australia. Crop and Pasture Science, 63(3): 191-202.
- Herbut P., Angrecka S., 2012. Forming of temperature-humidity index (THI) and milk production of cows in the free-stall barn during the period of summer heat. Animal Science Papers & Reports, 30(4): 363-372.
- Hunink J.E., Droogers P., 2011. Climate change impact assessment on crop production in Uzbekistan, World Bank Study on Reducing Vulnerability to Climate Change in Europe and Central Asia (ECA) Agricultural Systems, Report FutureWater, 106, pp. 160.
- Intergovernmental Panel on Climate Change (IPCC), 2014. Climate Change 2014: Synthesis Report. Contribution of Working Groups I, II and III to the Fifth Assessment Report of the IPCC, Geneva, Switzerland, pp. 151.
- Intergovernmental Panel on Climate Change (IPCC), 2017. Data Distrubition Center, http://www.ipcc-
data.org/ (accessed: 2 November 2017). - Işık M., Aydinşakir K., Dinç N., Büyüktaş K., Tezcan A., 2016. Evaluation of temperature-humidity index values on dairy cattle in Antalya conditions. Mediterranean Agricultural Sciences, 29(1): 27-31.
- Kapluhan M., 2013. Drought and drought in Turkey effect of agriculture. Marmara Geographical Review, n.27, pp 487-510.
- Keskin G., Dellal İ., 2011. Gross margin anaysis for dairy cattle in Trakya Region. Journal of the Faculty of Veterinary Medicine, Kafkas University, 17(2): 177-182.
- Key N., Sneeringer S., Marquardt D., 2014. Climate change, heat stress, and US dairy production. USDA Economic Research Report, 175, pp. 39.
- Knapp K.C., Konyar K., 1991. Perennial crop supply response: a Kalman filter approach. American Journal of Agricultural Economics, 73(3): 841-849.
- Lakew H., 2017. Economic Impact of Climate Change on Milk Production: A Case Study of Selected Areas in the Free State, MSc Thesis, University of the Free State, pp. 85.
- Lobell D.B., Field C.B., 2007. Global scale climate–crop yield relationships and the impacts of recent warming. Environmental research letters, 2(1), 014002, pp. 7.
- Mauger G., Bauman Y., Nennich T., Salathé E., 2015. Impacts of climate change on milk production in the United States. The Professional Geographer, 67(1): 121-131.
- Mérel P., Yi F., Lee J., Six J., 2013. A regional bio-economic model of nitrogen use in cropping. American Journal of Agricultural Economics, 96(1): 67-91.
- Ministry of Environment and Forestry, 2008. Meriç-Ergene Havzası Koruma Eylem Planı, Çevre Yönetimi Genel Müdürlüğü, pp. 205.
- Ministry of Food, Agriculture and Livestock, 2017a. 2018 Yılı Bütçe Sunumu, 2 November 2017, Ankara, pp. 168.
- Ministry of Food, Agriculture and Livestock, 2017b. İl Tarımsal Yatırım Rehberleri, www.tarim.gov.tr/
SGB/TARYAT/Sayfalar/Detay.aspx?SayfaId=7 (accessed 21 October 2017). - Ministry of Forestry and Water Affairs, 2017. İklimSu Veri Tabanı, http://iklim.orman su.gov.tr/ NewCBS/ (accessed 7 October 2017).
- Newbold P., 1995. Statistics for Business and Economics. Upper Saddle River, New Jersey: Prentice-Hall International, pp. 867.
- Ouraich I., Dudu H., Tyner W.E., Cakmak E.H., 2018. Agriculture, trade, and climate change adaptation: a global CGE analysis for Morocco and Turkey. The Journal of North African Studies, pp. 31.
- Özdoğan M., 2011. Modeling the impacts of climate change on wheat yields in Northwestern Turkey. Agriculture, ecosystems & environment, 141, pp. 1-12.
- Paggi M., 2011. California Agriculture’s Role in the Economy and Water Use Characteristics. The Center for Agricultural Business, California State University, Fresno, pp. 22.
- Ravagnolo O., Misztal I., 2000. Genetic component of heat stress in dairy cattle, parameter estimation. Journal of Dairy Science, 83(9): 2126-2130.
- Russo C., Green R., Howitt R.E., 2008. Estimation of supply and demand elasticities of California commodities. University of California, Working Paper, No. 08-001, pp. 29.
- Sejian V., Gaughan J., Baumgard L., Prasad C., 2015. Climate Change Impact On Livestock: Adaptation and Mitigation. New Delhi: Springer India, pp. 532.
- Sejian V., Gaughan J., Bhatta R., Naqvi S.M.K., 2016. Impact of climate change on livestock productivity, Feedipedia-Animal Feed Resources Information System, 24: 1-4.
- Sen B., Topcu S., Türkeş M., Sen B., Warner J.F, 2012. Projecting climate change, drought conditions and crop productivity in Turkey. Climate Research, 52: 175-191.
- Silkin H., 2014. İklim Değişikliğine Uyum Özelinde Bazı Uygulamaların Türkiye Açısından Değerlendirilmesi, Orman ve Su İşleri Bakanlığı, Ankara, pp. 185.
- Sinha R., Ranjan A., Lone S., Rahim A., Devi I., Tiwari S., 2017. The impact of climate change on livestock production and reproduction: ameliorative management. International Journal of Livestock Research, 7(6): 1-8.
- St-Pierre N.R., Cobanov B., Schnitkey G., 2003. Economic losses from heat stress by US livestock industries. Journal of Dairy Science, 86: E52-E77.
- Şahin K., 2001. A research on structural features and marketing of dairy farms in Kayseri Province. Yuzuncu Yıl University Journal of Agricultural Sciences, 11(1): 79-86.
- Talim M., Saner G., Karahan Ö., Engindeniz S., 2000. Türk-Anafi Projesi Kapsamındaki Süt Sığırcılığı İşletmelerinde Prodüktivite ve Rantabilite Üzerine Bir Araştırma, Bornova, İzmir, pp. 96.
- Tarımsal Ekonomi ve Politika Geliştirme Enstitüsü (TEPGE), 2017. Temel Tarımsal Ürünlerin Arz ve Kullanım Projeksiyonları, http://www.tepge.gov.tr/Dosyalar/Yayinlar/ a5b373b49c434b8089ce7584a
6b8362b.pdf, pp. 59 (accessed: 5 October 2017). - Trakya Development Agency (TDA), 2015. Trakya Bölgesi̇ Süt Ve Süt Ürünleri̇ Sektör Araştırması Raporu, pp. 76.
- Turkish State Meteorological Service (TSMS), 2016. Köppen İklim Sınıflandırmasına Göre Türkiye İklimi, Ankara, pp. 18.
- Turkish State Meteorological Service (TSMS), 2017a. Türkiye Ortalama Nem, https://www.mgm.gov.tr/FILES/resmi-istatistikler/Turkiye-Ortalama-Nem.pdf (accessed: 12 February 2017).
- Turkish State Meteorological Service (TSMS), 2017b. Sıcaklık Stresi Hesaplama Programı (SINEP), http://212.175.180.206/sinep/ (accessed: 10 February 2017).
- Turkish Statistical Institute (TurkStat), 2014. Livestock Statistics, www.turkstat.gov.tr/ PreTablo.do?alt_id=1002 (accessed: 17 October 2017).
- Turkish Statistical Institute (TurkStat), 2017. Agricultural Prices and Economic Accounts, www.turkstat.gov.tr/PreTablo.do?alt_id=1004 (accessed: 10 October 2017).
- Turkish Statistical Institute (TurkStat), 2018. Regional Statistics, biruni.tuik.gov.tr/bolgeselistatistik/tabloOlustur.do (accessed: 1 February 2018).
- Turp T., Öztürk T., Türkeş M., Kurnaz M.L., 2015. Assessment of projected changes in air temperature and precipitation over the Mediterranean region via multimodel ensemble mean of CMIP5 models. J. Black Sea/Mediterranean Environment, 21, Special Issue: 93-96.
- Uzmay A., 2017. Determination of farmers opinions about the affects of livestock policies on dairy cattle farms: sample of Izmir Province. Ege Journal of Agricultural Research, 54(2): 167-175.
- West J.W., Mullinix B.G., Bernard J.K., 2003. Effects of hot, humid weather on milk temperature, dry matter intake, and milk yield of lactating dairy cows. Journal of Dairy Science, 86(1): 232-242.
- Yaslıoğlu E., İlhan H., 2016. An analysis of dairy cattle production in Southern Marmara in terms of heat stress. Journal of Tekirdag Agricultural Faculty, 13(4): 12-19.
- Yılmaz H., 2010. Economic and social effects of support through cooperatives to dairy farms: case of Adana Province, Ph.D. Thesis, Department of Agricultural Economics Institute of Natural and Applied Sciences, University of Cukurova, Adana, pp. 292.