Abstract
Calanda is a municipality in the province of Zaragoza, Spain. Every year since mid-September until beginnings of November this area produces a famous high quality peach with Protected Denomination of Origin “Calanda” (PDO Calanda peach). The aim of this study is to value by Best-Worst scaling which of the ten PDO Calanda peaches attributes are more important for consumers and to find out the market segments. Main results show that the most important characteristics of PDO Calanda peaches are taste and ripeness and the least are packaging and fuzziness of the skin. Some preferences differences were found matching consumers’ socio-demographic characteristics.
DOI: 10.30682/nm1802f
Etiénne Groot*, Luis Miguel Albisu**
* São Paulo State University (Unesp), College of Agricultural and Technological Sciences, Dracena, SP, Brazil.
** Food Research and Technology Centre of Aragon (Cita), Zaragoza, Spain.
Corresponding author: etigroot08@gmail.com.
1. Introduction
Growing peaches in the Aragon region has been occurring for centuries. A specific area of Aragon – Calanda – has been recognized to have peaches with excellent qualities. The Protected Denomination of Origen (PDO) Calanda was set up in 1999 as a response to the request of Calanda Peach Producer Association. The Regulatory Council is responsible for maintaining and increasing the product prestige and the quality differentiation, by controlling the fruit production process as well as the quality norms for marketing purposes. In 2015, its total production was 2,600.00 tons (CRDOMC, 2016).
Peaches with this PDO only can be found in the market since the beginning of September until the beginning of November, which is the end of the marketing season for peaches cultivated in the Northern Hemisphere. According to the Regulatory Council norms, those fruits must be produced by three clones (Jesta, Evaisa and Calante), and they should have some common characteristics such as good appearance (no injury, clean, etc.), uniform yellow cream to straw-coloured skin, minimal size of about 73 mm diameter, toughness between 3.5 to 5.0 kg/0.5 cm2 and sugar content superior to 12 Brix degree (CRDOMC, 2016). The norms also demand the accomplishment of several specific peach production techniques to reach a high fruit quality standard.
In order to control the Mediterranean fly (Ceratitis capitata), growers have to protect the fruits with paraffin bags. This operation is expensive, demands a great labour force and it has consequences on fruit ripeness and taste. To increase fruit size, growers have to undertake thinning techniques, after the physiological fall period, which remove about 70% of the existing fruit in the tree. This process also demands great labour force. The hand thinning cost was estimated by Romero-Salt (2006) in 0.140 euros/kg, which represents 24.56% of total cost. The costs of hand thinning and labour add up 0.273 euros/kg and it embodies 47.89% of total cost. This productive technique to reach greater peach sizes has not been checked with consumers’ perception and its relative importance in comparison to other attributes.
Growers are struggling every day to produce high quality fruit, but up to now they do not know which attribute of PDO Calanda Peaches is most appreciated by consumers. Thus, this work aims to study consumers’ preference toward PDO Calanda peaches’ attributes in Zaragoza, Spain, with the view to suggest marketing strategies to improve PDO Calanda peach production chain. Lists with priority aspects of PDO Calanda peaches quality, from the market as a whole and from market segments, were elaborated. Improving the attributes of quality, especially the most important in the eyes of consumers, the final product will leave the consumer more satisfied, which give to the PDO Calanda peaches more market competitiveness.
Cicia et al. (2012) studied the existence of segments of peach consumers in Germany and the impact of different Country of Origin Labelling, organic certification and PDO/PGI on buying decision. They found three market segments. First segment (48% of consumers) with clear preference for the Italian products, second segment (41%) with preference to Spanish products and the last with the particular preference for Turkish peaches. All segments prefer peaches with PDO/PGI and produced under organic system.
The “ideal” peach is that fruit with the best quality attributes combination. It was studied by Olmstead et al. (2015). The top attributes of the “ideal” peach include good flavour, texture, size and firmness. Consumers prefer sweet, juicy, round characteristics. Young consumers (ages 18-24) prefer crisp, firm peaches with good flavour, whereas older consumers (ages 51-64) prefer sweet and melting peaches. Thus, it is expected that consumers appreciate PDO Calanda peaches taste, smell, size and texture. Different segments of preference are also expected.
In this work a Best-Worst analysis has been undertaken to sort out the preferred consumers’ peaches attributes. The Best-Worst Choice Experiment (BWCE) overcomes some problems presented by others measurements and rating methodologies. Indirect measures provided by discrete choice experiments provide richer insights into trade-offs and, as they have a natural link with actual choices, they should be more valid than direct measures, like Likert scale (Louviere and Islam, 2006). An advantage of BWCE, over a traditional “most-preferred” choice question, is the extra information about individuals’ preference. It provides greater amount of information of individuals per choice set with less cognitive burden on respondents (Louviere et al., 2009).
The BWCE was used in many fields of research. The BWCE has been used to study patient preferences (Lancsar et al., 2013; Krucien et al., 2016), residential location (Balbontin et al., 2015), transportation (Beck et al., 2017) and consumers preferences toward food (de Magistris and Gracia, 2017; Lagerkvist, 2013).
The work is structured as follows. The next section deals with the methodology Best-Worst scaling, the approach followed for the survey and proposed econometric model. The third section shows the results, firstly presenting the average preferences and then consumers’ socio-demographics characteristics are taken into account. The last section presents the conclusions.
2. Methods and Data
2.1. Best-Worst Choice Experiment and the econometric approach
The Best-Worst Choice Experiment (BWCE), also known as MaxDiff question, was proposed by professor Louviere and Woodworth as an extension of Thurstone’s random utility theory (RUT) in 1990. There are 3 cases of BWCE. Here it is employed the BWCE of case 1, in which alternatives are objects/items (Louviere et al., 2013). In this experiment individuals are invited to choose the most and the least important objects/items in each choice set. Thus, consumers had to state the most and the least important attributes of PDO Calanda peaches in different choice sets.
Marley and Louviere (2005) proved that the BWCE shares a common theoretical framework with the Random Utility Theory (Thurstone, 1927; McFadden, 1973). This theory determines that the indirect utility (in this case, importance) of alternative q for respondent i (Uqi) can be decomposed in two parts: the deterministic element (Vqi), which is observed by the researcher; and a stochastic element (eqi), which is the unobserved influence on individual choice (equation 1).
Uqi = Vqi + eqi (1)
The probability of individual i states alternative “g” as the most important attribute over any alternative “h”, can be expressed as the probability that the importance associated with alternative “g” exceeds that association with all other alternative (equation 2). On the other hand, the probability of individual i states alternative “g” as the least important over any alternative “h”, can be expressed as the probability that the importance associated with alternative “g” not exceeds that association with all other alternative.
![]() (2)
(2)
In order to derive an explicit expression for this probability, it is necessary to know the distribution of the error terms (eig). A typical assumption is that they are independently and identically distributed with an extreme-value (Weibull) distribution. It implies that the probability of any particular alternative “g” be chosen as the most important can be expressed in terms of the logistic distribution (McFadden, 1973). This specification is known as the conditional logit model (equation 3):
![]() (3)
(3)
Where µ is a scale parameter, which is inversely proportional to the standard deviation of the error distribution. This parameter cannot be identified and is therefore assumed to be one. This model can be estimated by conventional maximum likelihood procedures, with the respective log-likelihood function indicated in the equation 4. In this equation, yij is an indicator variable which takes value 1 if respondent i choses option j and zero otherwise.
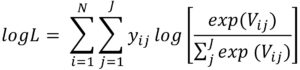 (4)
(4)
Equation 5 represents the consumers mean preference. It is specified as a linear equation of attributes. Variables were coded as dummy. In the Logit model one estimates the intercepts or “alternative-specific constants” (Louviere et al., 2013). So if alternative j is the attribute taste, x1 takes the value of 1 and all other variables takes zero value. As texture (10th attribute) is taken as the attribute of reference, represents the relative utility or importance of taste in relation to texture.
![]() (5)
(5)
It is recognized that the specific behaviour and taste may be conditioned by individual factors. Modelling observed interaction in choice models, allow identifying personal characteristics that focus on certain attributes only in decision making. In order to reflect the heterogeneity, mean parameters were decomposed in interaction effects (equation 6). This model estimates main effect (from beta one to beta 9) and interaction effects with m covariates (all other betas).
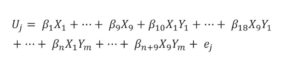 (6)
(6)
It was estimated two models with main and interactions effects. The first measured the interactions among attributes’ importance and gender, age, education and income. In coding, gender has value 1 if the consumer is female and zero if he is a man; age assumes value 1 when consumer is older than 50 years and zero otherwise; education assumes value 1 if consumer has not studied in college and zero otherwise; and income has value 1 when consumer’s family income is less than 1,500 €/month and zero otherwise. The second model considered the interaction among attributes’ importance and consumption frequency and the preference for products substitute to PDO Calanda peach. In this model, if consumer is sporadic the variable is coded 1 and 0 otherwise and if consumer would buy a no stone fruit when PDO Calanda brand wouldn’t be available at market the variable takes value 1 and 0 if consumer would purchase a stone fruit.
The estimations of the relative importance of attributes (equation 5) as well as the relative importance of attributes for different kind of consumers (equation 6) were estimated with the software Biogeme, version 1.7 (Bierlaire, 2008), which makes Multinomial Logit Model (MNL) estimations. The attribute “texture” was considered as the reference; hence it received a zero score.
2.2. Survey and data
The survey elaboration had three steps: the first was the selection of the most important attributes of PDO Calanda peaches, the second was to design the choice sets and the last one was to get the data. The selection of the most important attributes of PDO Calanda peaches was backed by the specialized literature, which was complemented with a focus group and face-to-face interviews to fruit managers working at four retail companies.
For the first step a focus group and interviews with the responsible of fruit and vegetables sessions were undertaken. The idea was to obtain the attributes according to their criteria so they could be, later on, included and fully understood at the consumers’ survey. The 10 most relevant PDO Calanda peaches attributes for marketing strategies were selected: (1) taste, (2) skin colour, (3) price, (4) production in bags, (5) smell, (6) peach size, (7) packing, (8) ripeness, (9) skin fuzziness and (10) texture.
The experimental design was elaborated following the recommendations of Orme (2005) and Chrazn and Patterson (2006). Each attribute was repeated 4 times through choice sets and choice sets included 5 attributes (Figure 1), so the total number of choice sets was 8 (10×4/5). The choice can be considered that it does not demand a hard effort for the respondents. The next step of the choice experiment design was the distribution of the attributes though choice sets.
Figure 1 – The illustration of the first choice
|
Card 1 |
||
|
Least important |
Characteristic |
Most important |
|
Colour |
||
|
Size |
||
|
Skin fuzziness |
||
|
Produced in bags |
||
|
Taste |
The software “Sawtooth MaxDiff Designer” was used to do simulations with different combinations of the attributes to obtain the best experimental design properties. According to Orme (2006) this program, by default and in order, considers the following properties: one-way frequency (how many times each attribute appears across the entire design), two-way frequencies (how many times each pair of items appears within the same set across the entire design), positional frequencies (report how many times each item appears in the 1st, 2nd,…, 5th position) and connectivity (all items are linked directly).
As a result of one million interactions, the final outcome is a design with no lack of connectivity and is a one-way frequency balanced and with a positional frequency mean of 0.8 and standard deviation of 0.4.
In the questionnaire, besides the BWCE, there were questions about PDO Calanda peaches related to consumption habits, competitive fruits and socio-economic data. Consumption habits questions tried to distinguish between occasional and regular PDO Calanda peaches consumers
The data was collected in 2008 in two hypermarkets, in the city of Zaragoza – Spain, between the 30th of October and the 8th of November, at the end of PDO peaches season. The period was chosen because consumers were more familiar with the presence of PDO peaches at markets and so they could perform better their product valuation. People were invited to participate in the survey randomly. Each respondent got one kilogram of PDO Calanda peaches to compensate the collaboration.
In total, information from 316 PDO Calanda peaches consumers was collected by face-to-face interviews. Consumers were randomly invited to the interviews when they were entering or leaving the hypermarkets. Sampling error was estimated in 5.6%. It was calculated considering Trespalacios et al., (2005) for a finite population (Zaragoza had less than 1 million people), a same probability of selecting a target and a no target individual with 95% of confidence.
3. Results and discussion
3.1. Sampled consumers’ profile
Table 1 shows sampled consumers’ socio-demographic characteristics. 59.2% of total consumers were women. A greater proportion of women is a desired characteristic in this kind of study because it is closer to the real percentage of women buying peaches in the market. According to Cerdeño (2006) and Cámara Madrid (2005), women are to a great extent responsible of fruit and vegetable purchases in Spain.
Age is another characteristic that influences fruit consumption in Spain. For children and adolescents, consumption tends to decrease with age. For adults, this relation is the opposite (Cerdeño, 2011). It happens as a consequence of a higher income and knowledge with age, but also it is a consequence of social habits and stimuli. The average age of sampled consumers is 45.5 years old and ages are more concentrated between 26 and 65 years old.
Table 1 – Consumers’ socio-demographics characteristics.
|
Characteristics |
Nº of people |
% |
|
Consumers’ gender |
||
|
Male |
129 |
40.8 |
|
Female |
187 |
59.2 |
|
Consumers’ age |
||
|
Younger than 25 years old |
21 |
6.6 |
|
From 26 to 35 years old |
63 |
19.9 |
|
From 36 to 49 years old |
105 |
33.2 |
|
From 50 to 65 years old |
88 |
27.8 |
|
Older than 65 years old |
39 |
12.3 |
|
Consumers’ education level |
||
|
Elemental |
87 |
27.5 |
|
High School |
130 |
41.1 |
|
College |
99 |
31.3 |
|
Consumers’ family income |
||
|
Until 900 €/month |
23 |
7.3 |
|
901-1,500 €/month |
84 |
26.6 |
|
1,501-2,100 €/month |
72 |
22.8 |
|
2,101-3,000 €/month |
81 |
25.6 |
|
3,001-4,000 €/month |
32 |
10.1 |
|
More than 4,000 €/month |
24 |
7.6 |
|
Total |
316 |
100.0 |
In the sample, 27.5% of consumers had elementary education while 31.3% had college backgrounds. In 2008, in Zaragoza city those values were 31.1% and 24.4%, respectively. Hence, on average, sampled consumers have higher education level than the entire population. The positive relation between education level and income may explain why sampled consumers have higher income than the average population. Family income of 7.3% sampled consumers is less than 900 €/month while 12% of population’s family income is lower than 750 €/month (IAEST, 2010).
PDO Calanda peaches are consumed with different frequency (Table 2). Around 1/3 of consumers consume it more than twice a week and almost 1/3 eat 1 or 2 times a week. The rest of them consume PDO Calanda peaches less often during the marketing season. In this study regular consumers have been considered those who consume PDO Calanda peaches at least once a week. All other consumers are assigned as sporadic consumers.
Table 2 still presents which product consumer would purchase if PDO Calanda peach wouldn’t be available at market. Initially, it was assumed that consumer would purchase a similar product, like another peach, with high degree of substitutability, but results show contrary behaviour. It was found that 23% of consumers would buy another peach, but 67% would purchase a no stone fruit, which are little resembling peach.
Table 2 – PDO Calanda peaches consumption frequency in the city of Zaragoza in 2008 and Consumers’ loyalty degree toward PDO Calanda peaches.
|
Characteristics |
Percentage |
|
Consumption frequency |
|
|
More than 2 times/week |
33 |
|
1-2 times/week |
32 |
|
1 time/2 week |
15 |
|
1 time/month |
10 |
|
1 time/season |
10 |
|
Substitute product |
|
|
Peach |
23 |
|
Nectarine |
4 |
|
Other stone fruit |
6 |
|
No stone fruit |
67 |
|
Total |
100 |
3.2. Average preference
On average, consumers consider that the most important PDO Calanda peach attribute, at purchase time, is taste followed by ripeness and smell (Table 3). The least important attribute is packaging and the second least is skin fuzziness. Ripeness is associated with sweetness and this result converge with other studies, such as Delgado et al. (2013) who find that sweetness is the main driver of consumer purchase intent and willingness to pay by California consumers. In the case of PDO Calanda peaches, they have to be harvested at least with 12º Brix, to guarantee its sweetness (CRDOMC, 2016).
Apparently, the PDO Calanda peaches market strategy is more appropriate than the common strategy adopted by other peach producers as they specify a minimum sweetness degree. It is worth noting that the main improvement of new cultivars, in the peach industry, has been focused on fruit appearance, in particular size and colour. The second significant gain has been the increase of fruit quality throughout fruit taste diversification (Cantín et al., 2010; Llacer et al., 2012). Thus, even with the difficulty to achieve the minimum required level of sugar, the market has recognized this commitment of PDO Calanda peaches by increasing their appreciation and value.
The second most important PDO Calanda peaches attribute is ripeness (Table 3). Harvesting ripened peaches may guarantee peaches with good taste and smell. Flesh firmness is the best indicator of ripening and one predictor of shelf life (Crisosto, 2007). The Regulatory Council is concerned with this attribute and it determines that PDO Calanda peaches have to be harvested when their flesh reaches at least 3kg/0.5 cm2. It avoids peaches bruising as well as reduces physical damage during transportation and handling, although flesh hardness should be lower when peaches are consumed. According to the Sterling Rice Group for the PPN Network: 2005 National Eating Trend – NPD Eating Trend (SRG, 2005), the best peach/nectarine firmness, to sell peaches in USA, is whenever their flesh is firm. Hard or soft peaches may influence purchase negatively. Our findings support such concepts of “ready to eat” and “tree ripe” proposed by Crisosto (2006) to increase consumer satisfaction and consequently increase peach consumption.
PDO Calanda peaches have retail prices 30 to 80% higher than similar peaches without PDO. Polo (2007) reports that 40% of wholesalers dealing with PDO Calanda peaches estimate that they have prices 20% greater than the same peaches without PDO. According to consumers, price is the 4th most important attribute.
According to Wolf et al. (2003), Florkowsky et al. (2003) and Predieri et al. (2006), buyers normally pay more attention, when purchasing fruit, on its appearance (colour and size) than others cues. Maybe, for this reason, they misevaluate ripeness and they get disappointed when fruits are consumed. Texture is one indicator to know if peaches are ready to eat (Crisosto, 2006; Crisosto et al., 2003) but, apparently, it is not considered when consumers purchase peaches.
Bruhn (1995) and Groot and Albisu (2015) relate a positive relationship between peach size and purchase intention. PDO Calanda peach size has, at least, 73mm of diameter, nevertheless it was considered as its third least important attribute. Why didn’t consumer give importance to this attribute? Probably because there was similar big size peaches in the Zaragoza market during the PDO Calanda peaches marketing season. Groot (2011) observes that the smallest peaches from the Calanda area (with or without PDO) in this market were bigger than 73mm.
The fuzziness of the skin has been incorporated in this work because it is a crucial characteristic that distinguishes peaches from nectarines (Uva et al., 2004). Many articles support the idea that nectarines are gaining market share from peaches, especially young people, because the advantage of having smooth skin. In our case, skin fuzziness is the second least important attribute on consumers purchase decision. During the interviews, many consumers said that they don’t bother to peel the skin. Our results are not surprising because most consumers eat peaches at home, where they require less convenient products.
Table 3 – The relative PDO Calanda peaches attributes importance1.
|
Attributes |
Parameter value2 |
Std. err. |
t-test |
|
Taste |
1.99*** |
0.082 |
24.42 |
|
Ripeness |
1.26*** |
0.074 |
17.17 |
|
Smell |
0.59*** |
0.076 |
7.73 |
|
Price |
0.33*** |
0.082 |
3.99 |
|
Skin colour |
0.04ns |
0.080 |
0.45 |
|
Produced in bags |
– 0.68*** |
0.084 |
– 8.10 |
|
Peach size |
– 0.85*** |
0.076 |
– 11.11 |
|
Skin fuzziness |
– 1.41*** |
0.077 |
– 18.39 |
|
Packaging |
– 1.76*** |
0.078 |
– 22.66 |
|
Number of estimated parameters |
9 |
||
|
Number of observations |
5,056 |
||
|
Final log-likelihood |
– 5,958.5 |
||
|
Adjusted R2 |
26.7% |
Notes: (1) the attribute importance is in relation to the texture importance. (2) The sign (***) means that the estimated parameter is statistically different from zero at 1% probability and that parameter without statistical significance is represented by (ns).
Enterprises are concerned on selling products matching consumers’ needs. Product convenience is an important consideration for consumers to mitigate their lack of shopping and eating time. Special packaging and technical treatments are ways to increase peaches shelf live, at distribution outlets, and to compensate for their short maturing period (Oria-Almudí, 2001; Nerón, 2008; Akbudak and Eris, 2004; Malakou, 2005; Wang et al., 2005). Traditionally, PDO Calanda peaches are presented in one layer box that maintains fruit quality. However, results show that consumers consider packaging as the least important attribute on their purchase decision. It might have to do with the price they have to pay and the economic circumstances Spain was going through at the period the survey was undertaken.
Another way to present results is shown in Table 4. The graphic shows the probabilities, expressed in percentages, that consumers consider price more important than each attribute on their purchasing intention. Equation 3 was used for this purpose. The probability may be considered as market share. Hence, only 16% of consumers would say that price is more important than taste and 84% of consumers would say the opposite. However, the probability of considering price more important than peach size will be for 76% of consumers.
Table 4 – Probability of choosing price in comparison to other attributes.
|
Attributes |
Probability (%) |
|
Taste |
16 |
|
Ripeness |
28 |
|
Smell |
44 |
|
Skin colour |
57 |
|
Texture |
58 |
|
Produced in bags |
73 |
|
Peach size |
76 |
|
Skin fuzziness |
85 |
|
Packaging |
89 |
3.3. Preference heterogeneity
Table 5 shows the main effect and interaction effect among attributes’ importance and gender, age, education and income. The main effect represents the preference of a man, younger than 50 years old, with high education level (college) and with high family income (more than 1,500 €/month).
Table 5 – The relative importance of PDO Calanda peaches attributes for different consumers’ socioeconomic characteristics
|
Attributes |
Main effect1 |
Interaction effect |
|||
|
Gender |
Age |
Education |
Income |
||
|
Taste |
2.29*** |
0.27ns |
-0.61*** |
-0.54*** |
0.03ns |
|
Ripeness |
1.50*** |
0.04ns |
-0.14ns |
-0.31* |
-0.23ns |
|
Smell |
0.64*** |
0.03ns |
0.13ns |
-0.14ns |
-0.20ns |
|
Price |
0.34*** |
0.13ns |
-0.42** |
0.38* |
-0.04ns |
|
Skin colour |
0.32** |
-0.21ns |
-0.42** |
0.01ns |
0.03ns |
|
Produced in bags |
-1.08*** |
-0.17ns |
0.74*** |
-0.15ns |
0.57*** |
|
Peach size |
-0.59*** |
-0.38*** |
-0.29* |
0.15ns |
0.07ns |
|
Skin fuzziness |
-1.60*** |
0.01ns |
-0.00ns |
0.30ns |
0.16ns |
|
Packaging |
-2.05*** |
-0.19ns |
0.17ns |
0.28ns |
0.57*** |
|
Number of estimated parameters: |
45 |
||||
|
Number of observations: |
5,056 |
||||
|
Final log-likelihood: |
-5,841 |
||||
|
Consistent Akaike Information Criteria (CAIC) |
12,110.4 |
||||
|
Adjusted R2: |
27.7% |
Note: (1) The sign (***) means that the estimated parameter is statistically different from zero at 1% probability and that parameter without statistical significance is represented by (ns)
The interaction effects parameters indicate that women give less importance to peach size than men on their purchase decision. Men and women prefer different physical size. In the Focus Group, carried out before the survey, it was mentioned that men are able to each much larger peaches than women and that people prefer to eat few large pieces instead of many small ones. Hence, peach size is more important for men than for women.
Age influences quality perception of PDO Calanda peaches. Consumers who are older than 51 years old give less importance to taste, price, skin colour and fruit size than other consumers. However, they give more importance to produce them in bags, i.e., to the production system. The survey had no questions about consumers’ working experience in the Calanda area. The PDO Calanda peach industry is sensitive to this market preference because there were many shops selling peaches in bags.
Education also influences PDO Calanda peaches quality perception. Consumers without college education give less importance to PDO Calanda peaches taste and ripeness, and more importance to price. Similar result is found by Delgado et al. (2006) with meat taste perception.
Packaged fresh products are convenient. However, in Spain, consumers know that packaged fruits have higher prices at market place (Cerdeño, 2006). It is also know that low income families are more sensitive to price when they purchase fresh products (Leibtag and Kaufman, 2003). Thus, it is understandable to observe that consumers with low family income give more importance how PDO Calanda peaches are packaged than for consumers from families with high income.
Table 6 shows consumers preferences with respect different attitudes toward PDO Calanda peaches. In this model, the main effects parameters represent the average preference of a consumer who consumes PDO Calanda peaches regularly and would purchase no stone fruits if PDO Calanda peaches would not be available in the market. This model also shows that taste, ripeness, price and fruit skin colour are more important for sporadic than for regular consumers, but producing peaches in bags is less important on their purchase decision. In order to improve consumption frequency within this group it is advisable to promote DOP Calanda peaches at selling points with the slogans, such as, “ready-to-eat” and “unsurplassable taste”.
Table 6 – The relative importance of PDO Calanda peaches attributes for different consumer attitudes
|
Attributes |
Main effect1 |
Interaction effect2 |
|
|
Regular |
Wouldn’t buy another stone fruit |
||
|
Taste |
2.7*** |
-0.51*** |
-0.45** |
|
Ripeness |
1.7*** |
-0.39*** |
-0.23ns |
|
Smell |
0.79*** |
-0.26ns |
-0.03ns |
|
Price |
0.01ns |
-0.39** |
0.83*** |
|
Skin colour |
0.42** |
-0.46** |
-0.11ns |
|
Produced in bags |
-1.10*** |
0.42** |
0.21ns |
|
Peach size |
-0.71*** |
-0.25ns |
0.03ns |
|
Skin fuzziness |
-1.09*** |
-0.19ns |
-0.31* |
|
Packaging |
-1.88*** |
-0.00ns |
0.16ns |
|
Number of estimated parameters: |
27 |
||
|
Number of observations: |
5,056 |
||
|
Final log-likelihood: |
-5,896.7 |
||
|
Consistent Akaike Information Criteria (CAIC) |
12,051 |
||
|
Adjusted R2: |
27.2% |
Note: (1) The sign (***) means that the estimated parameter is statistically different from zero at 1% probability and that parameter without statistical significance is represented by (ns). (2) All variable are categorical. The variable regular assumes value 1 of consumer consumes PDO Calanda peaches at least once a week in its season; Loyal has value 1 if consumer would purchases a no stone fruit when PDO Calanda Peach wouldn’t be available in the market.
Results indicate that those consumers who would purchase another stone fruit when PDO Calanda peaches weren’t available give more importance to taste and skin fuzziness of PDO Calanda peaches than other consumers. However, price is less important for them. An appropriate market strategy to increase PDO Calanda peaches consumption among them is to improve PDO Calanda peaches convenience, although it would have higher prices. PDO Calanda peaches could be sold sliced with no skin in special packages, ready to eat.
4. Conclusion
Peach production and consumption has a long tradition in Spain. Peach producers have undertaken special efforts to develop new cultivars to enlarge the productive season as well as to improve fruit appearance. They have also adopted expensive productive techniques in order to improve peaches quality. However, lack of market information about consumers’ reactions limits peaches marketing and productive efficiency.
This work deals with consumers’ preferences toward PDO Calanda peaches in the city of Zaragoza (Spain). Those peaches are produced with high quality standards and they are certified by the Regulatory Council with a label that can be recognised by consumers. Consumers are close to the production area so their concerns about local products fully apply.
According to our results, consumers consider that attributes linked to sensory quality are the most important. In order to improve sales, it is advisable to promote peaches at market selling points with messages strengthening that only PDO Calanda peaches guaranty a great taste and smelling experience, and it is harvested at the best maturing moment in order to reach the most appropriate ripeness. There are technical characteristics supervised by the Regulatory Council conducive to reach the optimum levels for those attributes. Consumers should be aware of the technical and marketing controls that PDO Calanda peaches go through to assure differences with other peaches.
However, not all consumers have the same perception. Thus, for old people, who give less importance to taste, it is important to reinforce that PDO Calanda peaches are produced using bags to protect fruits against the Mediterranean fly. Probably old people are also more attached to local products and they take for granted that they are produced following traditional methods. They assume the quality of those peaches and they have greater concern about the local environment and rural development as they understand better the peculiarities and culture behind peaches production in the area. The packaging practice of using only one layer in each box mainly influences this kind of consumers.
There are different market segments for PDO Calanda peaches, which imply possibilities for specific marketing strategies. There is a tendency among consumers to use different commercial channels according to their age and income, so the PDO Calanda peach industry should take account of these results to follow differentiated marketing approaches reinforcing different messages.
Packing is another feature that has economic connotations. Packing is desirable to save time but, in our case, average consumers do not appreciate it. However, high income consumers give more importance to it because its convenience. It is important to point that Spain had an economic crisis at the time the survey was undertaken and consumers were more sensitive about their spending.
Although this work provides good insights about PDO Calanda peaches market, there are some limitations that have to be mentioned. First, sampling was carried out with consumers of PDO Calanda peaches in the city of Zaragoza (Spain). Zaragoza is close to PDO Calanda peaches production area. Probably, if the study was carried out in another further away area, consumers’ knowledge and reactions about this specific product would be quite different. Another aspect of sampling is that only PDO Calanda peaches consumers participated in the survey. Although few people said that they didn’t consume PDO Calanda peaches, the survey can’t make observations about why people do not eat this product.
The Best-Worst method is appropriate to measure attributes importance. It is an easy choice for consumers and it provides a good trade-off among attributes. It performs better discrimination among attributes, which allows determining a priority list of PDO Calanda peaches attributes. Best-Worst models allow estimating efficient empirical models to deal with the preference heterogeneity.
In relation to the research method, Best-Worst model generate information of relative and not the absolute importance of attributes. There are investigations to overcome this limitation. Some people suggest using an anchoring system. It is not difficult to be implemented in the choice task, but there exist difficulty to relate it with purchase intention. More research has to be done in this sense.
References
Akbudak B. and Eris A., 2004. Physical and chemical changes in peaches and nectarines during the modified atmosphere storage. Food Control, 15: 307-313.
Balbontin C., Ortúzar J. de D., Swait J.D., 2015. A joint best-worst scaling and state choice model considering observed and unobserved heterogeneity: An application to residential location choice. Journal of Choice Modelling, 16: 1-14.
Beck M.J., Rose J.M., Graves S.P., 2017. I can’t believe your attitudes: a joint estimation of best-worst attitudes and electric vehicle choice. Transportation, 44(4): 753-772.
Bierlaire M., 2008. Estimation of discrete choice models with BIOGEME 1.7. http://biogeme.epfl.ch/
Bruhn C.M., 1995. Consumer and retailer satisfaction with the quality and size of California peaches and nectarines. Journal of Food Quality, 18: 241-256.
Cámara Madrid, 2005. La compra de alimentos en los hogares madrileños: Cambios en la última década. Encuesta de consumo en la Comunidad de Madrid. http://www.camaramadrid.es/asp/pub/docs/la_compra_de_alimentos_en_los_hogares_madrilenos_cambios_en_la_ultima_decada.pdf.
Cantín C., Gogorcena Y. and Moreno M.A., 2010. Phenotypic diversity and relationships of fruit quality traits in peach and nectarine [Prunus persica (L.) Batsch] breeding progenies. Euphytica, 171: 211-226.
Cerdeño V.J.M., 2011. Demanda de frutas y hortalizas en España: perfiles de consumo conforme a las características de los hogares. Distribución y Consumo, 119: 16-43.
Cerdeño V.J.M., 2006. Hábitos de compra y consumo de frutas y hortalizas: Resultados del observatorio del consumo y la distribución alimentaria. Distribución y Consumo, 88: 5-18.
Chrzan K. and Patterson M., 2006. Testing for the optimal number of attributes in MaxDiff questions. Sawtooth Software Research Paper Series. http://www.sawtoothsoftware.com.
Cicia G., Cembalo L., Del Giudice T., 2012. Country-of-origin effects on German peaches consumers. New Medit, 3: 75-79.
CRDOMC (Consejo Regulador DO Melocotón de Calanda), 2016. Datos y más datos. http://www.melocotondecalanda.com/.
Crisosto C.H., 2006. Peach quality and postharvest technology. Acta horticulturae, 713: 479-486.
Crisosto C.H., 2007. Cómo aumentar el consumo de melocotón: problemas y solucción. In: VI Jornada Técnica de l’Área de Postcollita: Avenços en la postcollita de la fruta d’os, 16th April, 2007, in Lleida, Spain.
Crisosto C.H., Crisosto G. and Bowerman E., 2003. Understanding consumer acceptance of peach, nectarine and plum. Acta horticulturae, 604: 115-119.
Delgado C., Crisosto G.M., Heymann H. and Crisosto C.H., 2013. Determining the primary drivers of liking to predict consumers’ acceptance of fresh nectarines and peaches. Journal of Food Science, 78: s605-s614.
Delgado E.F., Aguiar A.P., Ortega E.M., Spoto M.H.F. and Castilho C.J.C., 2006. Brazilian Consumers’ perception of tenderness of beef steaks classified by force and taste. Scientia Agricola, 63: 232-239.
De Magistris T., Gracia A., 2017. Do consumers care about European labels? An empirical evaluation using best-worst method. British Food Journal, printing.
Florkowsky W., Park T. and Bilgic A., 2003. External and internal index in fresh peach marketing. Acta Horticulturae, 604: 219-224.
Groot E., 2011. Choice experiments with best-worst alternatives to understand consumer behaviour: application to peaches with Protected Designation of Origin (PDO) Calanda. PHD thesis of UNIZAR/Zaragoza.
Groot E. and Albisu L.M., 2015. A bottom-up model to describe consumers’ preference towards late season peaches. Spanish Journal of Agricultural Research, 13(4): 13.
IAEST (Instituto Aragonés de Estadística), 2010. Datos básicos de Aragón: año 2010. http://portal.aragon.es/portal/page/portal/IAEST/IAEST_0000/IAEST_00/IAEST_001DB/IAEST_DB_001DB_INDICE/IAEST_001DB10.
Krucien N., Watson V., Ryan M., 2016. Is best-worst scaling suitable for health state valuation? A comparison with Discrete Choice Experiments. Health Economics, DOI 10.1002/hec.3459.
Lagerkvist C.J., 2013. Consumer preferences for food labelling attributes: comparing direct ranking and best-worst scaling for measurement of attribute importance, preference intensity and attribute dominance. Food Quality and Preference, 29(2): 77-88.
Lancsar E., Louviere J., Donaldson C., Currie G., Burgess L., 2013. Best Worst choice experiment in health: methods and application. Social Science & Medicine, 76: 74-82.
Leibtag E.S., Kaufman P.R., 2003. Exploring food purchase behavior of low-income households: How do they economize? Agriculture Information Bulletin, 747-07: 1-8.
Llacer G., Badenes M.L., Alonso J.M., Rubio-Cabetas M.J., Batlle I., Vargas F.J., Iglesias I. and Garcia-Brunton J., 2012. Peach breading in Spain. Acta Horticulturae, 962: 63-68.
Louviere J.J., Hensher D.A. and Swait J.D., 2000. Stated Choice Methods: Analysis and Applications. Cambridge: Cambridge University Press.
Louviere J.J. and Islam T.A., 2006. Comparison of importance weights and willingness-to-pay measures derived from choice-based conjoint, constant sum scales and best-worst scaling. Journal of Business Research, 61: 903-911.
Louviere J.J., Lings I., Islam T., Gudergan S., Flynn T., 2013. An introduction to the application of (case 1) best-worst scaling in marketing research. International Journal of Research in Marketing, 30(3): 292-303.
Louviere J.J., Street D., Burgess L., Wasi N., Islam T. and Marley A.A.J., 2009. Modelling the choices of individual decision-maker by combining efficient choice experiment designs with extra preference information. Journal of Choice Modelling, 1: 128-163.
Louviere J.J., Lings I., Islam T., Gudergan S. and Flynn, T., 2013. An introduction to the application of (case 1) best-worst scaling in marketing research. International Journal of Research in Marketing, 30: 292-303.
Malakou A., 2005. A combination of hot water treatment and modified atmosphere parking maintains quality of advanced maturity “Caldesi 2000” nectarines and “Royal Glory” peaches. Postharvest Biology and Technology, 38: 106-114.
Marley A.A.J. and Louviere J.J., 2005. Some probabilistic models of best, worst and best-worst choices. Journal of Mathematical Psychology. 49: 464-480.
McFadden D., 1973. Conditional Logit Analysis of Qualitative Choice Behavior. In: Zarembaka P. (ed.), Frontiers in Econometrics, New York: Academic Press, 105-142.
Nerón C., 2008. Desarrollo de envases activos que prolonguen el tiempo de vída del Melocotón de Calanda en condiciones de calidad. Informe primer año Proyecto INIA – Plan Teruel, Mejora del Melocotón de Calanda, Subproyecto 08. Centro de Investigación y Tecnologia Agroalimentaria de Aragón, Zaragoza, Spain.
Olmstead M.A., Gilbert J.L., Colquhoun T.A., Clark D., Kluson R., Moskowitz H.R., 2015. In pursuit of the perfect peach: consumer-assisted selection of peach fruit traits. HortScience, 50(8): 1202-1212.
Oria-Almudí R.A., 2001. Mantenimiento postcosecha de la calidad del Melocotón de Calanda. Informaciones técnicas: Dirección General de Tecnología Agraria, 96: 1-20.
Orme B., 2005. Accuracy of HB estimation in MaxDiff experiments. Sawtooth Software: Research Paper Series. https://www.sawtoothsoftware.com/download/techpap/maxdacc.pdf.
Orme B., 2006. MaxDiff Designer v2. Sawtooth Software. https://www.sawtoothsoftware.com/download/techpap/maxdiff_designer_manual.pdf.
Polo M.C., 2007. La comercialización del melocotón de Denominación de Origen Calanda. Master thesis of IAMZ/Zaragoza.
Predieri S., Ragazzini P. and Rondelli R., 2006. Sensory evaluation and peach quality. Acta Horticulturae, 713: 429-434.
Romero-Salt J., 2006. Melocotones de Calanda, variedades con personalidad propia. Dossier Fruticultura 2006. www.mapama.gob.es/ministerio/pags/Biblioteca/Revistas/pdf_Agri/Agri_2006_888_676_680.pdf.
Sterling Rice Group (SRG), 2005. Consumer insights: Understanding the California peach, plum & nectarine consumer. http://sunwestfruit.com/pdf/KeyFindings_Final.
Thurstone L.L., 1927. A law of comparative judgement. Psychologuical Review, 34: 278-286.
Trespalacios J.A., Vázquez R. and Bello L., 2005. Investigación de mercados. Madrid: Ed. Thomson.
Uva W.F., Cuellar S. and Cheng M.L., 2004. Consumer preferences and marketing opportunities for “Tree-repened peaches” in New York State. Cornell University, New York, USA, Department of Applied Economics and Management staff paper BR 2004-10.
Wang Y.S., Tian S.P. and Xu Y., 2005. Effects high oxygen concentration on pro- and anti-oxidant enzymes in peach fruits during postharvest periods. Food Chemistry, 91: 99-104.
Wolf M., Martin A. and Cagianut T., 2003. An analysis of the importance of ripeness to consumers in the United States when making a purchase decision of peaches, plums and nectarines. Acta horticulturae, 604: 61-65.