Abstract
This study aims to check for the contribution of knowledge and information to innovation activity in family olive farms in Bejaia province (Algeria), and looks for the most efficient sources and channels of knowledge and information flows. To do this, we have first computed an innovation index for a sample farms, whereupon we have carried out a statistical analysis using linear regression method to find out about the most significant determinants of innovation. The main result is that direct interactions between farmers and local public agricultural research as well as user/producer interactions along the value chain are of the most contribution to innovation. Nevertheless, it turns out that farmers seem not take advantage of the operational knowledge that spills over from most of other knowledge and information institutions and organisations.
DOI: 10.30682/nm1801c
Billal Maghni*, Kamal Oukaci*
* aboratoire d’Economie et Développement, Faculté des Sciences Economiques, Commerciales et des Sciences de Gestion, Université de Bejaia, Campus Aboudaw, Bejaia, Algérie.
Corresponding author: maghni@live.fr
1. Introduction
Olive growing in Algeria is characterized by the duality of the farming system, which dates back to the colonial period. A modern system is predominant in western Algeria and is intended for the production of table olives. In the other hand, traditional olive growing system, mostly devoted to olive oil extraction, prevails in mountain regions, essentially in Kabylia, a northern region of Algeria. There, olive growing, specifically olive oil, is of great identity and cultural value. Olive growing is mainly a family and subsistence farming, but some rural households get an extra income from the sold part of olive oil. Farms’ area is generally small (less than 5 hectares) and farming process is mostly rudimentary. Thus, trees are poorly maintained, harvesting is mostly done by hand, olives are stored in large plastic bags sometimes for a long time, before moving them to an olive oil mill, generally a traditional one. Paradoxically, while the extracted olive oil does not meet international standards mainly because of its high acidity, it is particularly appreciated by the local community. (Hadjou et al., 2013; Lamani and Ilbert, 2016).
This study focus on Bejaia province in Kabylia, where olive growing extends over more than 60 000 ha and represent about 70% of the total arboriculture area (Boudi et al., 2013). Through this study, we aim to check for the contribution of knowledge and information to innovation activity in family olive farms. We also look for the most efficient sources and channels of knowledge and information flows.
Innovation is a process through which farmers improve their production and farm management practices. This may involve planting new crop varieties, combining traditional practices with new scientific knowledge, applying new integrated production and post-harvest practices or engaging with markets in new, more rewarding ways. But innovation requires more than action by farmers alone. The public sector – working with the private sector, civil society, farmers and their organizations – must create an innovation system that links these various actors in order to foster the capacity of farmers to innovate. (FAO, 2014).
This article is structured as follows. We shall first provide an overview of the theoretical framework of this study. We then present a summary review of the evolution of agricultural policy in Algeria since independence. Afterwards we proceed with a presentation of the applied methodology, followed by a description of the data that will be used later in a statistical analysis. We shall conclude with a discussion of results.
2. Stylized facts and theoretical framework
Knowledge is conceived as an essential resource for innovation. From the perspective of the Neo-Schumpeterian evolutionary theory, innovations consist, in large part, of new combinations of existing routines. These could be defined as the firm’s memory where operational knowledge is stored. At the individual level, firm’s routines are similar to skills. The knowledge that underlies a skilful performance is in large measure tacit knowledge, in the sense that the performer is not fully aware of the details of the performance and finds it difficult or impossible to articulate a full account of those details. However, innovative firms need specialized knowledge, as well as more types of knowledge often available only outside the firm itself. Because of its tacit component, knowledge, and especially new knowledge can be difficult to acquire in the market, so firms seek some form of collaboration with other firms and/or institutions that possess the required knowledge and, on a reciprocal basis, are keen on sharing it. (Nelson and Winter, 1982; Morone and Taylor, 2012).
Moreover, information about novelties flows more easily among agents located within the same area, thanks to social bonds that foster reciprocal trust and frequent face-to-face contacts. (Breschi, 2001). In other words, any firm exists within a more or less complex network of other firms, suppliers and customers, as well as a range of organizations engaged in the production, distribution, and management of knowledge. Thus, innovation rest not only on physical infrastructures, but also upon user/producer interactions (Lundvall, 1988) and knowledge infrastructures (such as universities, publicly supported technical and research institutes or even government ministries). (Smith, 1997).
Olive-growing, like the overall agricultural sector, is supplier-dominated. In such a subsector, a relatively high proportion of innovative activities are directed toward process innovations. Moreover, one would expect a relatively high proportion of the process innovations used in olive growing to be produced by other sectors. The knowledge base of these innovations tends to relate to incremental improvements in the equipment produced elsewhere and/or to its efficient use. Indeed, farms make only a minor contribution to their process or product innovations. Most innovations come from suppliers of equipment and materials, although in some cases large customers and government-financed research and extension services also make a contribution. Thus, the process of innovation is primarily a process of diffusion of best-practice capital goods and of innovative intermediate inputs while endogenously generated opportunities are rather limited and so are R&D expenditures. (Pavitt, 1984; Dosi, 1988).
Possas et al. (1996) proposed a taxonomy of sources of innovation in agriculture as follows:
a. Private sources of business industrial organization, whose main business is to produce and sell intermediate products and machinery/equipment used in agriculture.
b. Public institutional sources, comprising universities, research institutions and public research enterprises. They run basic research activities; technology development and transfer.
c. Private sources related to agro-industries. They comprise agricultural product processing industries. The action of these sources may be either individual, coming from industrial processing firms which establish standards for the producers; or collective, through the formation of consortia to develop generic technologies that could be “homogeneously” appropriated.
d. Private sources, collectively organized and non-profit oriented, include producer cooperatives and associations whose main purpose is to develop and transfer new seed varieties and agricultural practices such as new planting methods, fertilizer and pesticide dosage, methods for pest control, irrigation, crop storage, etc.
e. Private sources related to services supply, such as firms selling technical support services, planning and production management and services related to grain production, crop and storage.
f. Farm production units, through which new knowledge is established in the learning process which sometimes can be translated into innovations. Indeed, skills and tacit/specific knowledge could be developed by farmers, as a result of their farming practice, in a typical “learning by doing” process.
3. Agricultural policy background
After independence of Algeria in 1962, colonial farms have been run under a workers’ self-management system. However, this participatory or cooperative economy did not take long to become a planning one. Moreover, with the agrarian revolution during the 1970s, unused private farmlands were nationalized and farms became even larger. (Bedrani and Bourenane, 1986; Bedrani, 1990).
This policy failed and has worsened with the 1980s oil glut which resulted in austerity and an agricultural sector reform from 1987. (Pluvinage, 1990). The reform was mainly characterized by the disengagement of the government from the management of the large farms and their fragmentation to smaller collective and even individual farms. Thus, farmers have gotten back the autonomy of management and thereby the responsibility to make the farms profitable. As a result of the structural adjustment programme (SAP) engaged by Algeria and the transition to market economy during the 1990s, the loans granted to farms declined sharply, the interest rate has significantly increased, and the agricultural subsidies have been cut off. All this caused an important disinvestment of private actors in the agricultural sector. (Djenane, 1999).
At the end of the 1990s, the SAP takes end and the financial situation of Algeria improved considerably thanks to the increase in oil price. This made it possible to set up an agricultural development programme from the beginning of 2000s. (Bessaoud, 2008) However, several factors have prevented the success of the development program, including lack of extension services support and low levels of education and agricultural training. (Laoubi and Yamao, 2012).
To remedy these shortcomings, a wider and more ambitious policy has set from 2009. One of the main axes of this policy is the development and upgrading of all stakeholders’ skills. It focuses in particular on a substantial investment in agricultural training, extension and R&D. For the first time, olive growing has been set as a priority and strategic subsector. (MADR, 2012).
As regard to agricultural R&D, the National Institute for Agronomic Research of Algeria (Institut National de Recherche Agronomique d’Algérie – INRAA) and the technical institute of fruit trees (Institut Technique de l’Arboriculture Fruitière et de la Vigne – ITAFV), which both have local branches in Bejaia province, carry out unilateral projects related to olive growing/oil sector, but also in collaboration with international organisations. For example, Algeria is currently taking part to at least three R&D and extension projects carried out by the International Olive Council. These projects are related to the genetic improvement of the olive, the installation of a pilot processing plant for demonstration and training to improve olive oil quality; and the recycling of olive wastewater and composted olive pomace generated by olive oil production as fertilizers.
Besides the local branches of INRAA and ITAFV, the public institutional environment of Bejaia province is endowed with eleven local agricultural administrations and one Chambre d’agriculture which ensure communication and coordination between research and extension institutions and farmers. Another major actor of the institutional environment is the University of Bejaia, mainly through basic research conducted by biology laboratories.
Along the olive oil value chain, the upstream side presents no specific characteristics. To the extent that they have sufficient finance capacity to pay the transaction totally or partially (in addition to a bank loan), olive-growers can acquire any equipment or authorized input from a local or foreign supplier.
On the other hand, the downstream side of the olive oil value chain is very typical. Indeed, farmers undergo very little or no pressure at all from processors to enhance olive quality or meet required standards. This is because olive processors seem to be satisfied with the prevailing market conditions. Not being required to meet standards and regulation exempt them from substantial expenses and investments. Besides, the activity of most of olive processors consists essentially of a service provision. Moreover, end consumers are satisfied by the value for money of the olive oil because of a strong information asymmetry about its purity. The phenomenon of adulterating olive oil on the informal market is indeed common because of a lax product and consumer safety regulation.
As for cooperation between farmers, besides the traditional mutual inter farms assistance in harvesting, there is indeed some local and national agricultural/olive oil non-profit oriented organisations, but on the other hand, there is no olive oil cooperative.
4. Methodological approach
The present study is based upon cross-sectional data collected from a survey of 60 olive farms in Bejaia province. To select the surveyed farms, we used the stratified sampling method with proportional allocation. The statistical population has been first divided into 52 strata, each corresponding to a municipality of Bejaia province. The number of olive farms surveyed in each municipality then has been determined using the number of olive trees as a weighting parameter. Thus, the number of the surveyed farms in each municipality was proportional to the number of olive trees it has, that is, to its olive potential. To select farms within each municipality, we have randomly drawn them from the local agricultural administration catalogue.
Among the attempts of adaptation of the Oslo Manual methodology to measure innovation in agriculture (OECD and Eurostat, 2005) is that of a research group belonging to a network of universities that studies different aspects of agribusiness firms in Colombia (Ariza et al., 2013; Guaitero et al., 2013; Saavedra et al., 2012).
Following this methodology, the data collected from our survey were subsequently used to compute the value of an innovation index (Innov) for each farm, as well as to get information about a set of variables that may contribute to the explanation of the variation in this index.
The survey was conducted as a face-to-face interview with the farmers. Most of questions were closed with two or more options, but there were also some open questions, specifically designed for identifying innovations from the motivation or the goal of the farmer through their implementation (reducing costs; improving performance; improving product quality; saving time; reducing health, environmental and occupational hazards; the penetration of a new market, etc.) (Saavedra et al., 2012).
The identification, selection and classification of innovations among changes introduced by the surveyed farms was carried out on the basis of experts’ judgments as well as the following definition of innovation concept provided by the Oslo Manual (OECD and Eurostat, 2005): «An innovation is the implementation of a new or significantly improved product (good or service), or process, a new marketing method, or a new organisational method in business practices, workplace organisation or external relations […]. The minimum requirement for an innovation is that the product, process, marketing method or organisational method must be new (or significantly improved) to the firm. This includes products, processes and methods that firms are the first to develop and those that have been adopted from other firms or organisations».
The innovation index (Innov) matches a unique numerical value for all the innovations of each olive farm. It is computed using the following formula (Ariza et al., 2013; Guaitero et al., 2013):
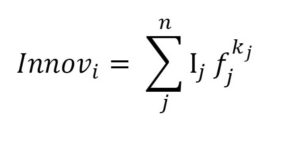 Where:
– Sub-index j refers to the j-th innovation (see Table 1);
– n is the total number of innovations in the surveyed sample of olive farms;
– Ij is an indicator function that tells us whether or not innovation j is implemented by the farm i;
– fj is the relative frequency of the j-th innovation in the sample; and
– the power kj is equal to -1, -1/2 and 0 for major, intermediate and minor innovations respectively.
Frequencies are measured in the interval ]0,1]. Given the values of the power kj, rare and major innovations are rewarded with the highest contributions to Innov (contributions higher than 1). Minor innovations add 1 to Innov, whether they are common or rare.
|
Table 1 – Innovations introduced by the surveyed family olive farms. |
|||
|
j |
Innovation designation |
Innovation |
kj |
|
01 |
planting a compatible variety for pollination |
process innovations |
-0.5 |
|
02 |
grafting |
0 |
|
|
03 |
intensive plantation |
-0.5 |
|
|
04 |
pruning for fruit production |
0 |
|
|
05 |
telescopic secateurs |
-0.5 |
|
|
06 |
water collection pits |
0 |
|
|
07 |
well drilling |
-0.5 |
|
|
08 |
subsurface irrigation |
-1 |
|
|
09 |
drip irrigation |
-1 |
|
|
10 |
organic soil amendments |
0 |
|
|
11 |
shakers equipped with catching frames |
-1 |
|
|
12 |
vibrating shaker |
-1 |
|
|
13 |
electric harvesting rake |
-0.5 |
|
|
14 |
hand harvesting rake |
0 |
|
|
15 |
harvesting net |
0 |
|
|
16 |
plastic vats for olive storage |
0 |
|
|
17 |
tillage |
0 |
|
|
18 |
manual and biological weed control |
0 |
|
|
19 |
bench terraces and earth dykes |
0 |
|
|
20 |
tractor purchasing |
-0.5 |
|
|
21 |
extra virgin olive oil |
marketing innovations |
-1 |
|
22 |
virgin olive oil |
-0.5 |
|
|
23 |
olive paste |
0 |
|
|
24 |
smoked glass bottles for oil storage and marketing |
-0.5 |
|
|
25 |
dark plastic bottles for oil storage and marketing |
0 |
|
|
26 |
creation of a marketing website |
-0.5 |
|
|
27 |
participation in trade fairs, shows or exhibitions |
0 |
|
|
28 |
common rental of transporting vehicle |
organisational innovations |
0 |
|
29 |
Mutual inter farms assistance in harvesting |
0 |
The minimum value of Innov is 0, for a farm with no innovations. The maximum value of Innov is given by the extreme case when all innovations are major, and a single farm implements all possible innovations in the sample and the remaining farms do not implement any one. A simple mathematical demonstration given by the original authors allows finding that this value is:
Innovmax = np
Where p is the sample size (total number of the surveyed farms).
It is quite important to point out that our survey asked the farmers about innovation activities during the last five years. Therefore, Innov only captures the innovation activities of the farm in this time frame (2010-2015). This is besides its main limitation. However, the choice of such period has at least two reasons. First, the five-year period is generally the one observed in obtaining the first significant productions of a new olive grove (IOC, 2007). The second reason is that beyond this period, it would have been difficult to the famers to remember fairly accurately the changes occurred in their activities.
5. Data description
The survey allowed us to identify 29 innovations implemented in the olive farms (see Table 1). The classification of these innovations following the Oslo Manual shows that 69% are process innovations, 24% are marketing innovations and 7% are organizational innovations.
As mentioned above, innovations were also sorted out according to their technological degree. This refers to those features of the innovation implemented by a farm, in terms of their distance with respect to the knowledge frontier, but also in terms of efficiency of the innovation according to the goal it was introduced for. Thus, based on the experts’ judgment, the identified innovations were classified to major, intermediate and minor innovations.
|
Table 2 – Summary statistics of numerical variables. |
||||||
|
Variables |
Min |
Q1 |
Median |
Mean |
Q3 |
Max |
|
Innov |
2.000 |
6.865 |
7.970 |
13.681 |
10.000 |
311.130 |
|
Winsor. Innov |
2.163 |
6.865 |
7.970 |
8.268 |
10.000 |
14.700 |
|
Area |
1.000 |
1.875 |
3.000 |
14.221 |
5.000 |
360.000 |
|
Winsor.Area |
1.000 |
1.875 |
3.000 |
3.985 |
5.000 |
9.688 |
|
Disp |
1.0 |
1.0 |
3.0 |
3.5 |
4.0 |
27.0 |
|
Winsor.Disp |
1.0 |
1.0 |
3.0 |
3.05 |
4.0 |
7.00 |
|
Age |
25.00 |
43.75 |
53.50 |
54.23 |
65.00 |
86.00 |
|
Stud |
0.000 |
6.000 |
9.000 |
8.933 |
12.000 |
19.000 |
|
Exp |
4.00 |
19.50 |
29.50 |
31.50 |
42.25 |
68.00 |
Among the variables defined as possible explanatory variables for variation in the innovation index (the independent variable Innov), the following six are numerical:
– Age: farmer’s age;
– Stud: farmer’s total number of years study;
– Exp: farmer’s experience (in years);
– Disp: number of distant and non-adjacent land parcels of the same farm;
– Area: farm’s area (in hectares).
Table 2 shows six summary statistics of these six numerical variables.
On the second row corresponding to the variable Innov, we note a clear discrepancy between the median value (7.97) and the mean (13.681) of the innovation index, as well as a large gap between the third quartile (Q3= 10) and the maximum value (Max = 311.13). Such discrepancies may be due to the presence of possible outliers. By an outlier we mean there any value lower than (Q1 – 1.5 x IQR = 2.16) or upper than (Q3 + 1.5 x IQR = 14.70). Indeed, the values of the variable Innov corresponding to observations No 9;11;12;21; and 42 are outside this interval. To reduce the effect of these outliers, we have made a transformation on the Innov series through winsorization, so that the outlier No 21 (Innov = 2.00) is set to the lower threshold (Innov = 2.16), and the remaining four outliers (No 9; 11; 12; and 42) are set to the upper threshold (Innov = 14.7). We have thus got a new series named Winsor.Innov cleaned from outliers. On Table 2, note that winsorisation has been applied on Area and Disp series too.
On the other hand, 15 dummy variables, plotted on Graph. 1, have been defined as follow:
– FEDAO: takes the value “1” if the farmer is a member of the Algerian Federation of Olive (Fédération Algérienne de l’Olive), which is a non-profit inter-professional organization aiming to coordinate actions and bring together actors from the upstream and downstream of the Algerian olive sector.
– INRAA: takes the value “1” if the farmer usually collaborates and co-operates with researchers from the local branch of INRAA.
– AT: takes the value “1” if the farmer is a member of Association Tazarajt which is a local farming association.
– UR: takes the value “1” if the farmer usually collaborates and co-operates with University Researchers.
– UNPA: take the value “1” if the farmer is a member of the National Union of Algerian Farmers (Union Nationale des Paysans Algériens).
– AHE: stands for Agricultural Higher Education. It takes the value “1” if the farmer and/or another member of the farm staff have an academic degree in agronomy.
– OM: takes the value “1” if the farmer has also an olive Oil Mill. It reflects vertical integration and scope.
– ITMAS: stands for Institut de Technologie Moyen Agricole Spécialisé. It takes the value “1” if the farmer has received a training courses at the agricultural vocational institute located in a neighbouring province (Tizi-Ouzou).
– ADOIO: takes the value “1” if the farmer is a member of the local Association for the Development of Olive-growing and Olive Industries (Association pour le Développement de l’Oléiculture et des Industries Oléicoles).
– Aid: takes the value “1” if the farmer has received a government aid or subsidies.
– SSA: takes the value “1” if the farmer goes regularly to the local agricultural administration (Subdivision des Services Agricoles) to be informed about new government aid programs and attends to extension sessions.
– CA: stands for Chambre d’Agriculture which is a public institution located in Bejaia city and run by elected officials whose role is to represent private actors of the agricultural sector and assist farmers in their development. It takes the value “1” if the farmer goes there regularly to expose his problems, to participate to debates and to attend to information and extension sessions.
– VC: stands for Value Chain. It takes the value “1” if the farmer judges that his interactions with suppliers, customers or other farmers have been of a significant contribution to the improvement of his activity.
– ITAFV: It takes the value “1” if the farmer has received short-term training courses at the local branch of ITAFV and/or regularly attends to extension sessions.
– Road: take the value “1” if the farm has direct access to a road. It reflects physical infrastructure facilities.
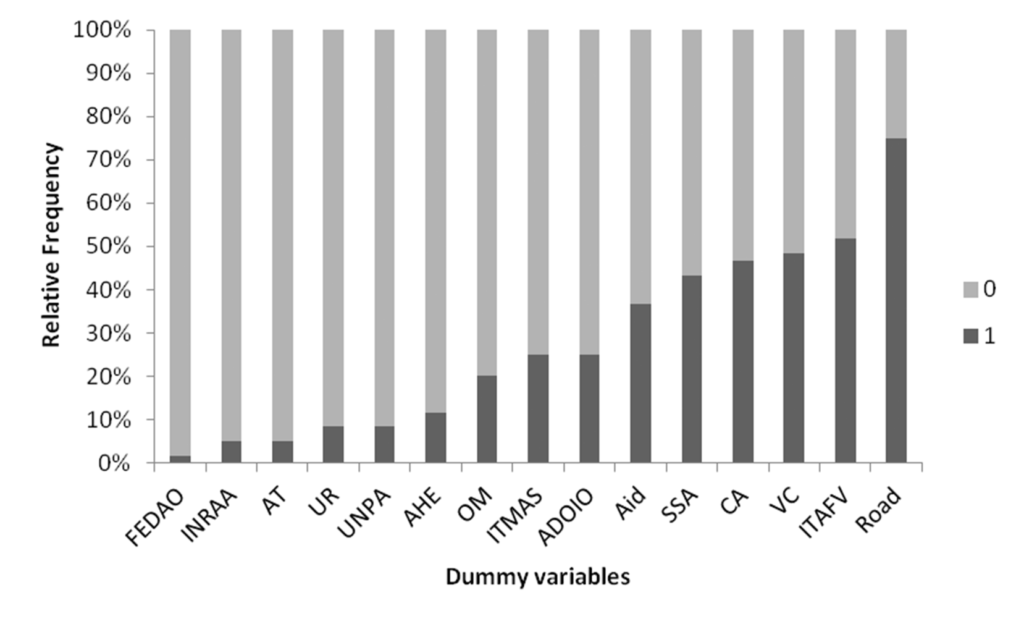
Graph. 1 – Stacked bar chart of dummy variables.
6. Statistical inference
Before performing a multiple regression, we have first made a pre-selection among the possible explanatory variables. To do this, we have tested for correlation between the dependent variable Winsor.Innov and each of the other five numerical variables. Then, we checked the output using a univariate regression between the same couples of variables.
The values of Spearman’s correlation coefficient reported on Table 3 show that only Winsor.Area is highly correlated with Winsor.Innov.
|
Table 3 – Spearman’s Rank Correlation Coefficient. |
|||||
|
Age |
Stud |
Exp |
Winsor. Disp |
Winsor.Area |
|
|
Winsor. Innov |
-0.12 |
-0.01 |
-0.11 |
0.07 |
0.82 |
Furthermore, given our significance level α = 5%, it follows from the output of the univariate regression models on Table 4 that Winsor.Area will be the unique numerical variable to be included in the multivariate regression as a possible explanatory variable.
|
Table 4 – Univariate Regression output with Winsor.Innov as the dependent variable. |
||||
|
Possible predictor |
Coefficient estimate |
standard error |
t value |
p-value |
|
Age |
-0.02905 |
0.02686 |
-1.081 |
0.284 |
|
Stud |
0.02129 |
0.07431 |
0.287 |
0.776 |
|
Exp |
-0.02611 |
0.02332 |
-1.119 |
0.268 |
|
Winsor.Disp |
-0.01371 |
0.20024 |
-0.068 |
0.946 |
|
Winsor.Area |
0.69975 |
0.08714 |
8.03 |
5.46e-11 |
As regards the dummy variables, we have carried out the Wilcoxon Rank-Sum Test for each variable in order to check if the value of Winsor.Innov is actually different whether the dummy variable of interest takes the value “1” or “0”.
From the outputs reported in Table 5, it appears that only the last eleven variables should be tested for their contribution to the variation of the innovation index value using the multivariate regression.
|
Table 5 – Wilcoxon Rank-Sum Test outputs with Winsor.Innov as the numerical variable. |
||
|
Dummy variable |
p-value |
Decision |
|
FEDAO |
0.1115 |
Since the Wilcoxon rank sum test p-values are greater than our significance level of 0.05, we cannot reject the null hypothesis that the innovation index value is the same whether the dummy variable of interest take the value “1” or “0”. |
|
AT |
0.9053 |
|
|
OM |
0.9926 |
|
|
Road |
0.1684 |
|
|
Aid |
0.0008484 |
Since the Wilcoxon rank sum test p-values are less than our significance level of 0.05, the null hypothesis that the innovation index value is the same whether the dummy variable of interest take the value “1” or “0” is rejected. |
|
AHE |
0.002498 |
|
|
INRAA |
0.004529 |
|
|
ITAFV |
4.553e-05 |
|
|
ITMAS |
0.0004375 |
|
|
UR |
0.02608 |
|
|
ADOIO |
0.004155 |
|
|
UNPA |
0.04879 |
|
|
CA |
1.028e-06 |
|
|
SSA |
2.477e-06 |
|
|
VC |
0.006661 |
To select the fittest multiple regression model, we first used the stepwise model selection procedure (Stowell, 2014; R Core Team, 2016), then we enhanced the selection after some trial and error attempts.
Before interpreting the selected model (Table 6), we have first assessed its fit by carrying out some procedures as model diagnostics.
Thus, to test for the normality of the error distribution, we performed Shapiro–Wilk test upon the standardized residuals series. From the output shown on Table 7 (cf. Annex), we can see that the p-value for the test is 0.9119. As this is greater than our significance level of 0.05, we cannot reject the null hypothesis that the standardized residuals series follow a normal distribution. Thus, the errors normality assumption of linear regression is met.
To test for errors homoscedasticity, we carried out the two versions of Breusch–Pagan test. The outputs reported on Table 8 (cf. Annex) show that the p-values of both tests are greater than our significance level of 0.05. Therefore, the null hypothesis of homoscedasticity of model’s errors cannot be rejected.
Moreover, the output of Bonferroni outlier test on Table 9 (cf. Annex) exhibits no extreme observations. Indeed, the farm or the observation No 15, corresponding to the largest standardized residual’s absolute value has a p-value greater than our significance level of 0.05 (< 0.62202).
|
Table 6 – Multivariate Linear Regression output using R software. |
||||
|
Call: |
||||
|
lm (formula = Winsor.Innov ~ Winsor.Area + INRAA + VC, data = olivdata) |
||||
|
Residuals: |
||||
|
Min |
1Q |
Median |
3Q |
Max |
|
-4.1702 |
-0.9912 |
0.0811 |
1.4677 |
4.7479 |
|
Coefficients: |
||||
|
Estimate |
Std. Error |
t value |
Pr (>) |
|
|
(Intercept) |
5.25233 |
0.45169 |
11.628 |
< 2e-16 *** |
|
Winsor.Area |
0.56644 |
0.09009 |
6.287 |
5.16e-08 *** |
|
INRAA1 |
3.12665 |
1.25613 |
2.489 |
0.0158 * |
|
VC1 |
1.25041 |
0.50618 |
2.470 |
0.0166 * |
|
Signif. codes: ‘***’ .001 ‘**’ .01 ‘*’ .05 ‘.’ ‘0.1’ ‘ ’ |
||||
|
Residual standard error: .921 on 56 degrees of freedom |
||||
|
Multiple R-squared: .6118, djusted R-squared: .591 |
||||
|
F-statistic: 9.42 on 3 and 56 DF, -value: .493e-11 |
Furthermore, it can be seen at the bottom of Table 6 that the p-value of the Fisher test is well below the significance level α = 5% (p-value = 1.493 e-11 < 0.05). We also note that the adjusted coefficient of determination (Adjusted R-squared =
R2 = 0,591) is rather close to 1. These results tell us that the model is a good fit to the data and includes a good combination of explanatory variables. Given the output of the Fisher test, the null hypothesis that all the coefficients of the model are null is rejected. As for the value of the adjusted coefficient of determination, it means that the model is able to explain about 60 % of the total variation in the innovation index of different family olive farms.
The output of the regression points out that only three of the twelve possible predictors have coefficient estimates significantly different from 0, namely: Winsor.Area; INRAA; and VC. Indeed, the Student’s t-test p-value computed for each of these coefficients estimates is less than the significance level α = 5%. Thus, the null hypothesis that one of these coefficients estimates is null has been rejected.
The positive coefficient estimate of the continuous variable “Winsor.Area” equal to 0.56644 means that on average, a farm whose area exceeds that of others by one hectare, ceteris paribus, would have a higher innovation index by a gap equal to 0.56644.
As for the coefficient estimate of a dummy variable, it indicates the average difference in the innovation index between farms with level “1” and those with level “0”, ceteris paribus.
In the present case, the coefficient estimates of both INRAA and VC are positive. More precisely, the coefficient estimate of INRAA is equal to 3.12665, while VC’s coefficient is equal to 1.25041.
Thus, INRAA is the variable that influences the innovation index variation the most, followed by VC, then Area (actually Winsor.Area).
7. Results and discussion
According to the taxonomy reported above (Possas et al., 1996), results of our study showed that innovation performance of family olive farms located in Bejaia province come from only one public institutional source, namely the local branch of INRAA. On the other hand, neither farmers’ training or attendance at both agricultural technical institutes (ITAFV and ITMAS), nor their interactions with the local agricultural administration turned out to have significant impact on olive farms innovation performance during the last five years. Moreover, farmers having an agricultural high education or interactions with university researchers do not show a higher innovation performance either. So ultimately, farmers seem not take advantage of the operational knowledge that spills over from most of knowledge and information institutional sources. This could be due to the inefficiency either of these institutions’ governance and/or the knowledge they are producing, transferring and diffusing.
Nevertheless, since we can argue that at least one research institution, namely INRAA, produces, transmits and/or transfers knowledge and information that make some farms more innovative than others, why then do some farmers have interactions with INRAA while others do not? The generic reason we could put forward is that farmers are not enough motivated to look for new and up-to-date knowledge and information, because there is not enough incentives to decide them to introduce change in their farms. Thus, disregarding the shortcomings of the agricultural research, extension, education and training system, and assuming that efficient knowledge and information are available and freely accessible, the fact remains that a no less serious problem lies in the lack of incentives among farmers to look for innovative knowledge and information.
According to the literature mentioned above (Pavitt, 1984; Dosi, 1988), one should have expected that most innovation in olive growing will consist essentially of new input and equipment. Indeed, our study showed that interactions of farmers with other actors of the value chain are one of three factors explaining olive farms’ innovation performance. But for the family farms to introduce innovations, they need sufficient financial resources. However, none of the farmers questioned during our survey have got a bank loan. This is why we didn’t include bank funding as a control variable. Moreover, olive growing is not the main source of income and/or not the only agricultural activity of most of family farms. So, it was not possible to get information about the self-financing capacity of farmers. Nevertheless, we can argue that most of families have low or moderate incomes. Consequently, farmers would find it too high the cost of opportunity of time and money to be engaged in olive growing innovation activity. Public subsidies would overcome this constraint, but it appears from our study that they do not motivate farmers to innovate more.
The third factor our study showed to impact olive farms innovation level in Bejaia province is scale. Because large farms could make economies of scale, they are therefore more likely to invest in innovation, and by the same token, more motivated to look for new knowledge and information. Thus, a second reason of the lack of incentives among farmers to innovate is the small size of most of family olive farms.
Moreover, the olive sector in Bejaia province is characterized by an acute lack of cooperation, competition and regulation. Despite the well known strength of social links and face-to-face communication in Kabylia, cooperation is still limited to the traditional collective harvesting, though even this becomes more and more rare. As mentioned earlier, while agricultural cooperatives have proved to be particularly appropriate as a form of organization to overcome farms’ size constraint (Szabó, 2002), paradoxically, there is no olive oil cooperative in Bejaia province. As shown by the present study, other modern forms of farmers non-profit oriented organizations (UNPA, FEDAO, ADOIO and AT) have not been enough efficient for innovation development either.
8. Conclusion
The study we have just carried out showed that overall, olive growers in Bejaia province seem not take advantage of their interactions with most of knowledge and information institutional sources. Nevertheless, one institution seems to be an exception, namely the local branch of INRAA. Indeed, our study showed that farmers who have direct interactions with researchers from this institution have, in general, a better innovation capacity.
From then on, the least measure policy makers have to take is to clearly define long-term agricultural R&D priorities and secure sustained funding. However, policy interventions must be as far as possible independent from budget fluctuations for a sustainable development trajectory of olive sector. Therefore, creative mechanisms, such as public-private partnerships in agricultural research, need to be explored to stimulate private funding for agricultural R&D, especially because the government is the principal source of funding (ASTI/IFPRI and INRAA, 2014).
Beyond the availability and efficiency of public institutions sources of agricultural knowledge and information, the issue of olive sector innovation in Bejaia province should be tackled from the incentives perspective too. Thus, policy interventions must focus not only on the reinforcement of agricultural knowledge institutions, but also on levers likely to enhance both cooperation and competition along the overall olive oil value chain. User/producer interactions are besides, the second source of innovations our study showed.
For guidance, one lever that decision makers could use as a catalyst of competition and innovation dynamics is regulation. This could be likened to the Porter hypothesis (Porter and van der Linde, 1995), except that rather than just environment, regulatory reform will focus much more on product and consumer’s safety along the downstream side of the olive oil value chain.
On the other hand, to enhance cooperation in the olive sector, policy intervention must promote agricultural cooperatives as an appropriate form of organisation to mutualise physical but also human assets, and overcome the small size constraint of most of family farms thanks to economies of scale. The main function of public authorities in order to do this is ensuring coordination of different stakeholders’ actions, and popularizing rules and advantages of agricultural cooperatives.
Acknowledgments
This study has been carried out with the help of experts from the local agricultural administration, as well as farmers and other members of professional associations and organizations.
References
Ariza C., Rugeles L., Saavedra D. and Guaitero B., 2013. Measuring Innovation in Agricultural Firms: A Methodological Approach. The Electronic Journal of Knowledge Management, 11(3): 185-198.
ASTI/IFPRI and INRAA, 2014. Agricultural R&D Indicators Factsheet – Algeria. https://www.asti.cgiar.org/sites/default/files/pdf/Algeria-Factsheet_0.pdf.
Bedrani S., 1990. L’expérience algérienne d’autogestion dans l’agriculture. Les Cahiers du CREAD, 23/24: 19-65.
Bedrani S. and Bourenane N., 1986. L’expérience algérienne de planification : le cas de l’agriculture. Les Cahiers du CREAD, 05: 95-119.
Bessaoud O., 2008. L’agriculture et la paysannerie en Algérie. Algiers: CRASC-ENAG.
Boudi M., Chehat F. and Cheriet F., 2013. Compétitivité de la filière huile d’olive en Algérie : cas de la wilaya de Bejaia. Les cahiers du CREAD, 105/106: 89-112.
Breschi S., 2001. Knowledge Spillovers and local innovation systems: A critical survey. Industrial and Corporate Change, 10(4): 975-1005.
Djenane A., 1999. Ajustement structurel et secteur agricole. Les Cahiers du CREAD, 46/47: 123-134.
Dosi G., 1988. Sources, procedures, and microeconomic effects of innovation. Journal of Economic Literature, 26(3): 1120-1171.
FAO, 2014. The state of food and agriculture: Innovation in family farming. Rome: Food & Agriculture Organization of the United Nations.
Guaitero B., Avermaete T., Rugeles L. and Ariza C., 2013. Innovation and transactional models in agricultural firms. Presented at the 7th Conference on Micro Evidence on Innovation in Developing Economies (MEIDE), Santiago de Chile, November 7-8.
Hadjou L., Lamani O. and Cheriet F., 2013. Labellisation des huiles d’olive algériennes: contraintes et opportunités du processus ? New Medit, 12(2): 35-46.
IOC, 2007. Production techniques in olive growing. Madrid: International Olive Council.
Lamani O. and Ilbert H., 2016. La segmentation du marché oléicole : Quelles politiques de régulation du marché d’huile d’olive en Algérie ? New Medit, 15(3): 19-28.
Laoubi K. and Yamao M., 2012. The challenge of agriculture in Algeria: are policies effective ? Bulletin of Agricultural and Fisheries Economics, 12(01): 65-73.
Lundvall B.-Å., 1988. Innovation as an Interactive Process: From User Producer Interaction to National systems of Innovation. In Dosi G., Freeman C., Nelson R., Silverberg G., and Soete L. (eds). Technical Change and Economic Theory. London: Pinter Publishers, 349-369.
MADR, 2012. Le renouveau agricole et rural en marche: revue et perspectives. http://www.minagri.dz/pdf/Divers/Juillet/LE_RAR-FR.pdf.
Morone P. and Taylor R., 2012. Proximity, knowledge integration and innovation: An agenda for agent-based studies. Journal of Evolutionary Economics, 22(1): 19-47.
Nelson R.R. and Winter S.G., 1982. An evolutionary theory of economic change. Cambridge, MA: The Belknap Press of Harvard University Press.
OECD and Eurostat, 2005. Oslo Manual: Guidelines for collecting and interpreting innovation data. 3rd ed. OECD online bookshop.
Pavitt K., 1984. Sectoral patterns of technical change: Towards a taxonomy and a theory. Research Policy, 13(6): 343-373.
Pluvinage J., 1990. Contribution à l’analyse des premiers résultats de la réorganisation des exploitations agricoles algériennes (1987). Les Cahiers du CREAD, 23/24: 287-296.
Porter M.E. and van der Linde C., 1995. Toward a New Conception of the Environment-Competitiveness Relationship. Journal of Economic Perspectives, 9(4): 97-118.
Possas M.L., Salles-Filho S. and da Silveira J., 1996. An evolutionary approach to technological innovation in agriculture: Some preliminary remarks. Research Policy, 25(6): 933-945.
R Core Team, 2016. R: A language and environment for statistical computing. R Foundation for Statistical Computing, Vienna, Austria, https://www.R-project.org.
Saavedra D., Rugeles L. and Guaitero B., 2012. How to ask Colombian farmers for innovation: a methodological approach. Presented at the 10th Global Network for the Economics of Learning, Innovation, and Competence Building Systems (GLOBELICS) International Conference, Hangzhou, China, November 9-11.
Smith K., 1997. Economic Infrastructures and Innovation Systems. In Edquist C. (ed). Systems of Innovation: Technologies, Institutions and Organizations. London: Routledge, 86-106.
Stowell S., 2014. Using R for statistics. Apress.
Szabó G.G., 2002. New institutional economics and agricultural co-operatives: a Hungarian case study. Presented at the International / European Research Conference on Local Society and Global Economy: The role of cooperatives. Naousa, Thessaloniki, Greece, May 9-12.
Annex
Table 7 – Shapiro-Wilk normality test output on standardized residuals.
|
Shapiro-Wilk normality test |
|
data: rstudent (lm (Winsor.Innov ~ Winsor.Area + INRAA +VC, olivdata)) |
|
W = 0.99018 , p-value = 0.9119 |
Table 8 – Heteroscedasticity Breusch-Pagan tests output.
|
Test 1 |
studentized Breusch-Pagan test |
|
data: lm (Winsor.Innov ~ Winsor.Area + INRAA + VC, olivdata) |
|
|
BP = 4.2848 , df = 3 , p-value = 0.2323 |
|
|
Test 2 |
Non-constant Variance Score Test |
|
Variance formula : ~ fitted.values |
|
|
Chisquare = 0.2811941 f = 1 = 0.5959196 |
Table 9 – Bonferroni outlier test output on standardized residuals.
|
No Studentized residuals with Bonferroni p < 0.05 |
|
|
Largest |rstudent|: |
|
|
rstudent nadjusted p-value onferroni p |
|
|
15 |
2.654483 .010367 .62202 |