Abstract
The purpose of this study is to develop a method to identify the radical changes in the Mediterranean adequacy index (MAI) trend for monitoring and modifying food and prevention policies. The development of a statistical solver demonstrates that the evolution of the MAI over time (1961-2013) in the EU countries, the USA and Japan is at least bi-parted. In most countries, often two successive conflicting tendencies emerge, whose intersection is signaled by a turning point. The framework of the “knowledge-based view” can help determine whether or not the slopes of the new trend are idiosyncratic with WHO objectives to prevent chronic diseases. Sustainably fighting against the rise in coronary heart disease (CHD) requires to incentive both demand and supply of food products Mediterranean-intensive, revealing by solver use the MAI hidden turning-points . This study allows policymakers to improve their planning, prevention and monitoring capabilities through more exact projections concerning both Mediterranean food markets and emerging CHD risks.
DOI: 10.30682/nm1902e
Maria Antonietta Lepellere*, Ting Fa Margherita Chang*, Maurizio Droli*, Luca Iseppi*
* University of Udine – Department of Agricultural, Food, Environmental and Animal Science, Italy.
Corresponding author: luca.iseppi@uniud.it
Cite this Item: Lepellere M.A., Chang T.F. M., Droli M., Iseppi L., 2019. The hidden turning points of the Mediterranean diet: a tool for health and agro-food policies. Rating out of fifty years, and 22 countries, New Medit, 18 (2): pp. 71-88, http://dx.doi.org/10.30682/nm1902e
1. Introduction
The Mediterranean diet (MD) is a multifactorial product since it is a result of «a set of traditions, symbols, rituals, knowledge, capacities and skills concerning crops, harvesting, fishing, animal husbandry, conservation, processing, cooking, and particularly the sharing and consumption of food» made operational (UNESCO, 2018). Experimental and clinical literature is unanimous in considering the MD, as a food bundle low-fat and rich-in-fiber, able to prevent risks of death (Barringer, 2001; Panagiotakos, Pitsavos and Stefanadis, 2006; Estruch et al., 2013; Delgado et al., 2016) from Coronary Health Disease (CHD). In particular, an inverse correlation between the adherence to MD and the mortality rate for CHD was found in cross-section longitudinal studies (Alberti-Fidanza et al., 1999; Fidanza et al., 2004; Chang et al., 2017; Palma and Padilla, 2012) focused on Mediterranean countries (Cyprus, Croatia, Spain, Greece, Italy, Morocco and Portugal) and abroad (Okinawa in Japan). This paper deals with the opportunity to adopt a Mediterranean diet type as a tool for supporting worldwide an healthy nutrition for both public health prevention and agro-food production promotion in 22 countries including Portugal, Spain, France, Italy and Greece.
In 2015, there were 17,7 million death for fatal and/or disabling pathologies which involve huge expenses for the public health systems of the various countries, loss of work and wage, family difficulty to survive with dignity given the private health costs (WHO, 2017; World Bank, 2017). Those are the reason moving the WHO to set, among its Global Action Plan 2013-2020, the voluntary country-based target for a 25% reduction in risk of premature mortality from those chronic pathologies that is the strategic “primary” objective No. 1 (WHO, 2013). Another primary WHO strategic target (No 7) is to halt the rise in diabetes and obesity through assessing «the main risk factors such as unhealthy diet» (WHO, 2013) representing an “instrumental”, related to agricultural policy, target. It becomes therefore crucial to establish whether there is a univocal descending or ascending trend in the time series concerning the adherence to MD or similar diet in order to estimate the perspectives of Mediterranean food market and CHD events in the future.
At first glance, FAO data (2011) on food balances (1962-2013), transformed into the Mediterranean Adequacy Index (MAI) for 22 countries, support the hypothesis that in fifty years the MD trend was mostly decreasing, but that in a majority of countries after a certain time the trend was splitted in two segments due to the occurrence of a structural turning point. Generally, the first of two was a decreasing trend while the second was an increasing or stable trend. The hidden problems are behind the idiosyncratic nature or less of the two trends. However, it is essential to establish the form of the function of the trends and determine if the turning point is a real turning point, followed by an upward or stable tendency, then reliable, or on the contrary a local minimum, then unreliable. If the variation would found in most countries, then the hypothesis of the presence of a turning point would be validated and able for the prediction of a progress to a healthy diet.
In addition, MD-based eating patterns well balance some foods including bread, cereals, potatoes, legumes, vegetables, fresh and dried fruit, fishery products, red wines and virgin olive oil, which are generally considered as a whole “healthy diet”. For the purpose of this study, it can play an important role in promoting public health, improving food and nutrition security, stimulating environmental protection and promoting socio-economic development in the entire Mediterranean region (CIHEAM/FAO, 2015). This healthy diet can represent a strategic resource based on evidence whose potentials are still waiting to be harnessed for the improvement of public health (Leonardi, 2015) and for a healthy agri-food policy. At the same time, stability at a high or low level of MAI or instability can produce general and economic diversified impacts. They include those on the state of health, life expectancy, health care spending interchange between domestic and international segments of the food system, composition and level of agro-food supply, consumptions, organization and transport of the distribution channels (Heinberg and Bomford, 2009). Objective of this study is finding a method to solve the problem of detection of a real turning-point if it exists. After setting the mathematical model, a problem-solver, corredated by an extensible and portable Excel sheet, has been designed and developed, able to establish the point that is candidate as experimental turning-point, (Appendix 1). It is placed where the sum of the errors of the two regression straight lines is minimized and indicates when profound structural changes can occur in the trend of eating habits (Piccinini et al., 2016). However, it might be only a variance minimization point. Thus, the model provides a further test for turning-point acceptance. The validation of the consistency of the results is done through the following sequential techniques: a) evaluation of coincidence between the experimental point of intersection, and the theoretical point; b) computation of the sum of the errors which derives from un/significant jumps in the MAI between the above two points; c) assessment of best goodness of a quadratic regression (parabolic) in the remaining cases. This method can be extended to other scientific fields where it is very important to identify the turning point of long data time series as in economics, and more specifically in the financial markets, e.g. when to sell stock exchange shares (Tang, 2010). Other main fields of applications are: in the image recognition, in agronomics etc. In the latter, the study of the turning point concerns, e.g. the relationship between the use of fertilizers and the productivity of soils or the increase of seed or bulb weight (Hongqiang et al., 2005), or the costs of inputs (Wang and Wan, 2012) or to characterize plant vegetation cycle (Zeist et al., 2017), But the casistic can be ample and diversified.
2. Theoretical framework
The conceptual lenses of the Resource-Based Theory (RBT) of organizational development and its spillover, the Knowledge Based View (KBV), have been adopted. The RBT (Barney, Ketchen and Wright, 2011; Barney, 1991; Wernerfelt, 1984; Penrose, 1959), representing a prominent theoretical framework, postulates that only productive factors achieving «above-threshold performances», thus «valuable», can be called «resources» strictu sensu. «Methodological challenges are recurrent themes in the RBT literature» (Barney, Ketchen and Wright, 2011, p. 1311). This study locates the above mentioned MAI idiosyncratic trends on public health policies and healthy food production policies, by focusing on above threshold values. Additionally, resources being Rare (concentrated among competitors), Inimitable (or at least difficult to be imitated) and Non substitutable (with no or low strategically equivalent resources), called “VRIN”, represent the only ones allowing decision makers to defend their above-threshold performances (Barney, 1991). Rarity, inimitability and non substitutability of those trends haven’t been considered by this study and represent research limits. Prominent perspectives, stemming from the RBT, include the Natural-Resource Based View (NRBV) of the firm (Hart, 1995), the Knowledge-Based View (KBV) of the firm (Foss, 2010; Grant, 1996) and dynamic capabilities (Teece, Pisano, and Shuen, 1997). To achieve stably positive performances, especially the KBV went to focusing on the importance of organizational knowledge representing the focus of this study. Following the KBV, knowledge appropriability, transferability and aggregability represent their main key-quality attributes to be considered when managing knowledge (Grant, 1996). Mainly due to the complex, non-circular and thus largely unpredictable interactions, existing among national lifestyles eating habits and healthy agro-food consumptions, especially knowledge appropriability and transferability have been considered by this study.
The intangibility of several of those resources required RBT scholars to develop even more robust methodologies trying to quantify performances achieved (Barney, 2001; Godfrey and Hill, 1995; Molloy et al., 2011; Hitt et al., 2007). Notwithstanding, several researches referred to especially intangible resources seemed to be burdened by problems of “construct validity” (Barney, Ketchen and Wright, 2011; Strauss and Smith, 2009) while performance of several resources remained largely untested (Hoopes and Madsen, 2008). This paper considers above threshold performances as the key-quality requisite of trends, countertrends and turning-points.
Moreover, despite the important role played by uncertainty and risks, and regardless the issue of “where resources and knowledge come from?” the issue of generating new knowledge represents important but relatively under-explored fields of research in the RBT literature (Godfrey and Gregersen, 1999; Ahuja and Kaila, 2004). Generally, risk refers to deviation of a quantified evaluator caused by its volatility over a certain period (Tóth et al., 2014). Since its conception, agricultural risk has often being intended as linked to uncertainty in weather, yields, prices, government policies and global markets impacting farming and which can cause drops in agricultural industry incomes (Dillon, 1971). Risk types in agriculture include production, credit, personal political and economic (Girdžiūtė, 2012, p. 785) while the importance of social environment as a source of uncertainty and risk has been often underestimated. The general idea lying behind this study is that «information from the social environment regarding the MAI, following forecasts errors and the risk of idiosyncratic situations can represent important sources of knowledge» (Kitagawa and Okuda, 2016, p. 487). Consequently, the value of idiosyncratic and non-idiosyncratic (potentially synergic) MAI trends have been taken into account here as well as in other studies focusing on consequences of forecasting errors (Ota, 2010; Kitagawa & Okuda, 2016). RBT studies on organizations’ commitment (Helfat and Lieberman, 2002), timing (Zott, 2003), and managerial capabilities focused on different sources of knowledge creation (Teece, Pisano and Shuen, 1997). Idiosyncratic situations can contribute to create new knowledge by invalidating the pre-existing one. Ordinarily, decision makers interpret recent trends in light of past ones. For instance, they believe that a “moderate” risk will cause more concern whether it was previously low compared to the high one and viceversa. Differently, turning-points require decision makers to interpret recent trends in light of the both present and underlying, thus “hidden”, ones. Following this approach, “moderate” risk of reduction in MAI will cause more concern only whether if it was accompanied by a idiosyncratic trend turning point.
The idiosyncratic situations, opportunities and trends tend to force organizations to generate new knowledge, can became the cornerstone of new knowledge acquisition processes and can stimulate public health organizations to embrace new search paths and planning processes.
But idiosyncratic and non-idiosyncratic situations can also induce forecast errors, reducing or augmenting the effectiveness of policies respectively, and increase the risk in a cumulative manner. This study intends to control the MAI organizational environment that is of main importance to early detect the contrasting tendency in time of the MAI before and after the turning-points, such as to recognize disorderly eating habits and to improve the effectiveness of public health and healthy agro-food production policies. In this study, the idiosyncratic and non-idiosyncratic trends can indicate the reduction or heighten, respectively, of healthy eating habits, and thus healthy agri-food consumption, through the use of MAI proxy.
3. Materials and methods
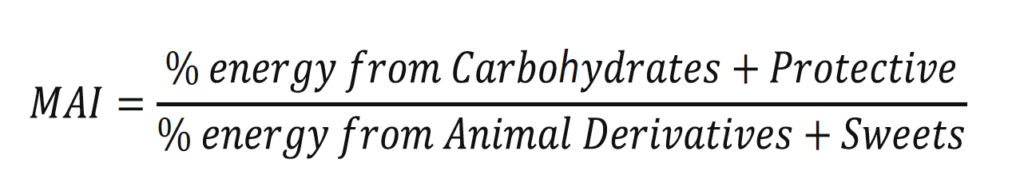
Several articles studying MAI trends have been published including Balanza (2007), Garcia-Closas (2006), Schmidhuber and Traill (2006), Da Silva (2009), Palma and Padilla (2012), Chang et al. (2017), Di Lascio and Disegna (2017), and Finardi (2018). Despite their achievements, at the state of our best knowledge, no studies dealing with eventual turning points in MAI trends and idiosyncratic risks emerged. The Mediterranean diet has been taken as a reference of both healthy food styles and healthy agro-food consumption to analyze its long-term evolution and see if the countries examined are going in the direction of consumption of good for health food or in the opposite one. As a measure of a virtuous behavior of the average consumer, the Mediterranean Adequacy Index (MAI) (Alberti-Fidanza et al., 1999; Fidanza et al., 2004) will be used. This index has previously been proved to be positively related to the reduction of cardiovascular degenerative diseases (Alberti-Fidanza et al., 1999; Fidanza et al., 2004; Chang et al., 2017). The MAI is the ratio between calories (kcal) of consumed food (daily per capita) that have positive impact on health (bread, cereals, potatoes, legumes, vegetables, fresh and dried fruit, fishery products, virgin olive oil, red wine) and calories derived from foods (meat, milk, cheese, eggs, animal fats and margarine, cakes, sugary drinks, sugar) that have been proved as having a negative impact on health: i.e.
The MAI was evaluated for the EU countries, Japan and USA using the database available by FAO named “Food Balance Sheets” (FBS). They are internationally harmonized and comparable data, used by researcher and public health officials (Balanza et al., 2007; da Silva et al., 2009; Palma and Padilla, 2012); they also may be used to give an important contribution of analysis for future health and food policies. The database includes about 100 different food items in a span of fifty two years (1961-2013) for more than 180 countries and aggregate geographical areas.
Belgium (inserted in FAO data as Benelux for the first period) and some of more recently EU members (Estonia, Lithuania, Latvia, Czech Republic, Slovenia and Croatia) were not included in this analysis because the number of annual data is insufficient to determine the turning year. The intention was to estimate the data also for the first period so that to integrate the series and the results of this study, but this goal has not been considered a priority also because it would involve a certain arbitrariness.
About the methodology, the authors have developed the original technique of the two regression segments to find the turning-point. The basic hypothesis to verify is that the series considered is not unidirectional: a trend is followed by a countertrend whose intersection point may be a turning-point. The purpose of the procedure is to make two linear regression in two stages: i) in the first stage the candidate turning-point is determined; ii) in the second stage, the linear approximation to the left and the right of the turning-point is calculated.
The two tests described below permit to establish the consistency of the results. To make the method extensible, an Excel sheet has been developed (Appendix 1) in which for any similar problem, the operator entering a series of data, in the appropriate column, manages to have the answer if the series has a turning-point and reconstruct the 2 tables that allow him to validate the turning-point through the two tests described below.
Let xa, …, x̄, …, xb be the sequence of times 1, 2, … 53, corresponding to the years 1961, 1962, …, 2013. For each point x̄, excluding the first and the last, the sequence of times on the Left = [xa, …, x¯] and Right = [x̄, …, xb] are considered.
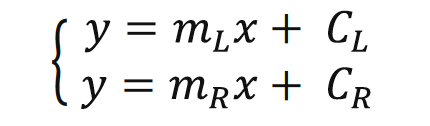
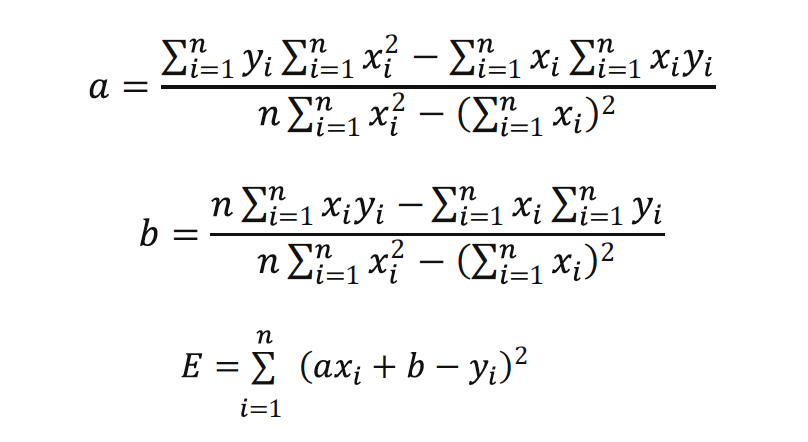
The linear regression on the Left points is determined obtaining the equation of the regression line
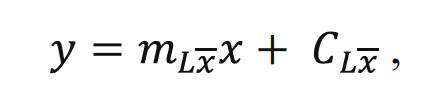
with quadratic error ELx; the same thing is repeated for the Right points getting
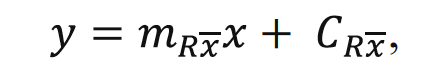
with quadratic error ERx. The minimum quadratic error of the system is calculated,
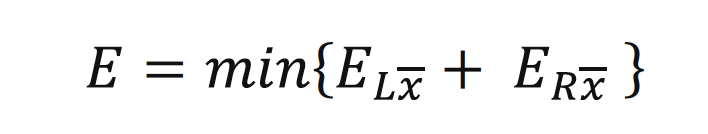
at the variation of x̄. The x̄ identifying the minimum is the candidate turning-point, that is the year of turn, and is called xc, which corresponds the value yc.
Regarding the verification tests, it must first be checked that E (minimum quadratic error) is significantly smaller than the quadratic error obtained with a single linear or quadratic regression.
At this point, the actual verification phase begins. The validation of the consistency of the results is done through this sequential technique: a) the evaluation of distance between the candidate point, and the theoretical point of intersection; b) computation of the sum of the errors representing below/above threshold, thus significant jumps in the MAI between the above mentioned two points.
Regarding the sequential technique a), the intersection point of the two left and right interpolation lines from the solution of the system is searched
After verifying that the lines are not parallel, that is mL does not coincide with mR, xS, yS, the two theoretical values are obtained as follows:
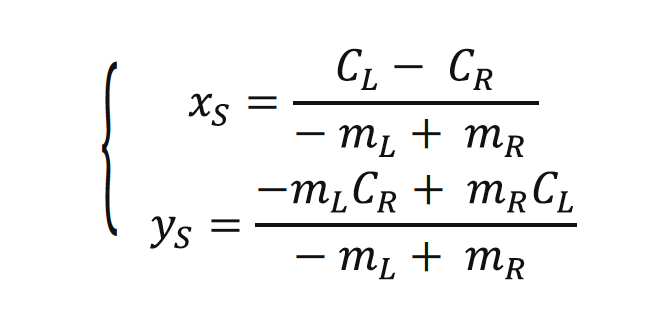
The following threshold-based stress-test has been established. If |xs – xc| < 4 the test is passed (Passed) otherwise no (Not Passed).
In the positive case, with the reference to the sequential technique b), it needs to verify that the difference between the true value of the MAI and the corresponding values of the two straight lines at xc, namely
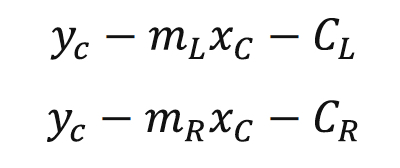
must be small enough to exclude too beveled curves or jumps at the turning-point. For this purpose, the sum of the 2 absolute values, divided by , is considered:
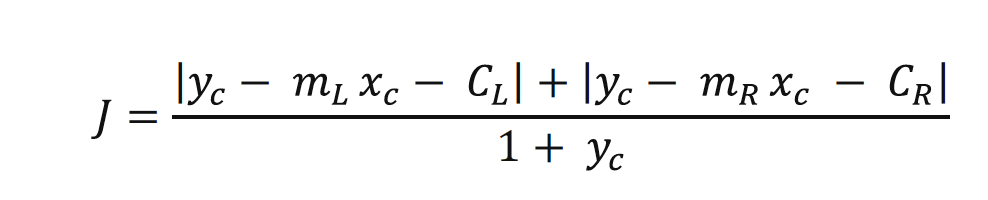
Experimentally, a second threshold of the Jump (J) adopted is J<2, but if 2 <J <4 the result can be accepted, but the corner is very beveled.
4. The recognition of the turning years in the Food styles
The analysis that follows reports the results of tests to establish the validity of the a year as turning-point by comparing the year in which the quadratic turning error is minimal with that obtained by the intersection of the two linear regression lines (left and right ones). For this purpose, the following third threshold-based evaluation system has been defined as suggested by RBT methodology. The test has passed in all cases where this difference, in absolute value, is less than 4 (first level threshold). The results are summarized in Table 1.
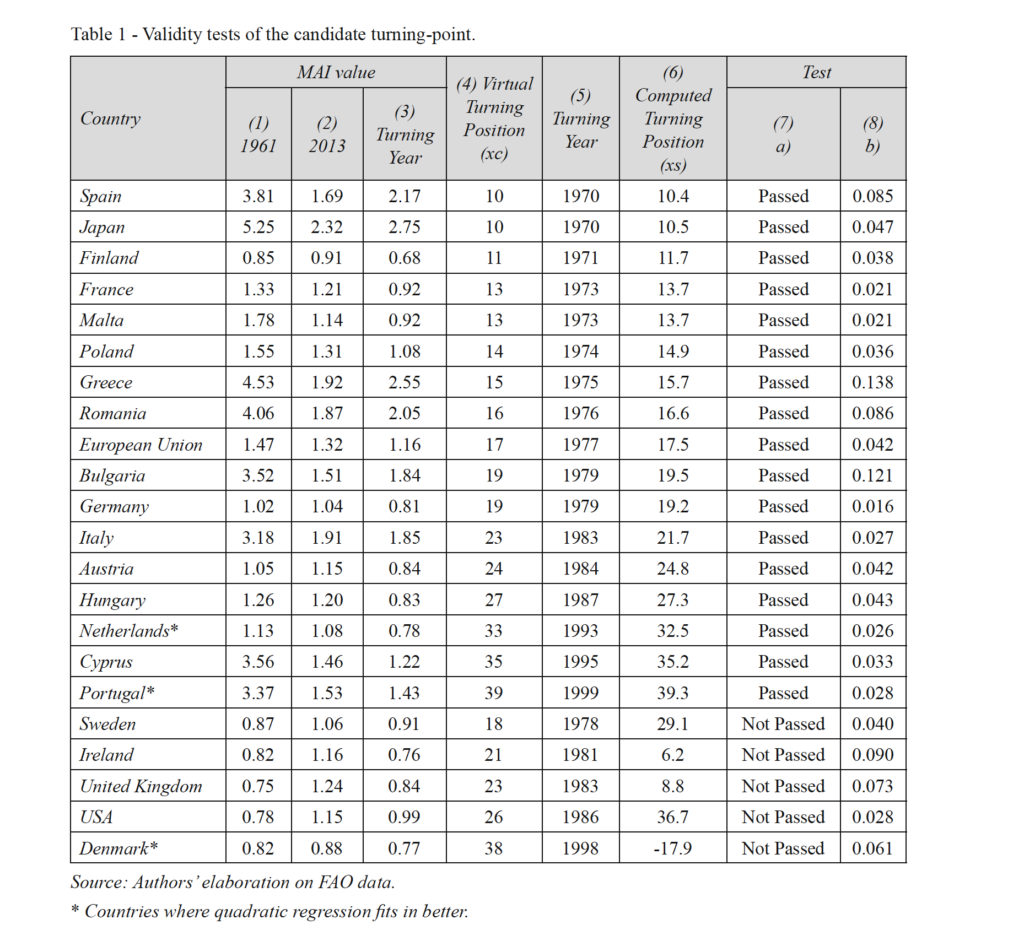
The third column in Table 1 indicates the actual MAI value in the turn year, and that year can be found in the fifth column. The corresponding Turning years (xC and xS; years elapsed since 1961), named virtual and computed, get the minimum error (E) with the intersection of the two segments, and are reported respectively in the fourth and sixth columns. The last two columns indicate the validity of the tests a) and b) respectively.
Of the 22 countries examined, 15 passed both tests (included the EU), 4 did not pass them (Sweden, Ireland, United Kingdom, USA, and Denmark), and 3 fitted better in the quadratic regression (The Netherlands, Portugal, Denmark), but the first two (Netherlands and Portugal) passed also the tests of the linear two-segments regression (Table 1).
In the first period, for the countries positively tested, before the turning-point, the Mediterranean Adequacy Index (MAI) had declined steadily and after it (second period) the trend has been imperceptibly decreasing or constant. In all cases, the Jump (J) deriving from the test b), largely explained in the methodology, assumes very low values to indicate that the MAI curve did not have jumps at the turning-point and/or was not too beveled.
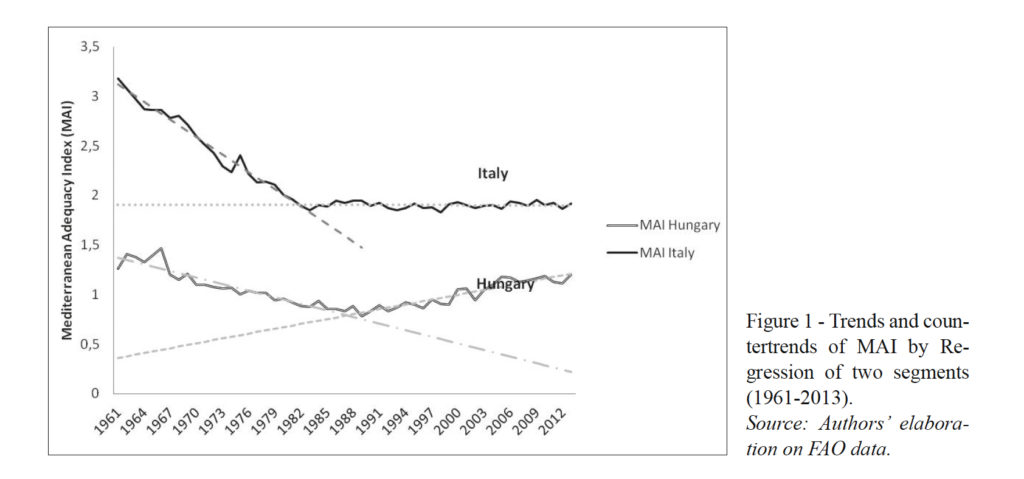
It should be noted that 11 out of 15 countries (included the EU and Japan) have a turning-point in the 70s of the last century, 3 in the 80s and one in the 90s. The most timely countries that have experimental turning-point in the Mediterranean Adequacy Index in the ’70s are Spain, Japan, Finland, France and Malta, and 10 years later (1983) Italy, followed by Austria, Hungary and Cyprus. The latter has the turning-point with a 12 years delay compared to Italy. To understand with an example the different timing, see Figure 1 in which MAI trends of the two left and right regression lines for Hungary and for Italy are displayed. After the turning-point, Hungary has a remarkable growth in the MAI, while Italy has a substantial constancy (Fig. 1). However, the levels of MAI achieved in 2013 are very different, as for Italy the MAI is much higher than Hungary. Actually Hungary, started with a Low MAI in 1961, confirmed that level also in 2013, while Italy, on the contrary, also after the drop has remained in the High range of MAI for more than an half century (Fig. 1).
5. Results: the significance of slopes in the two periods
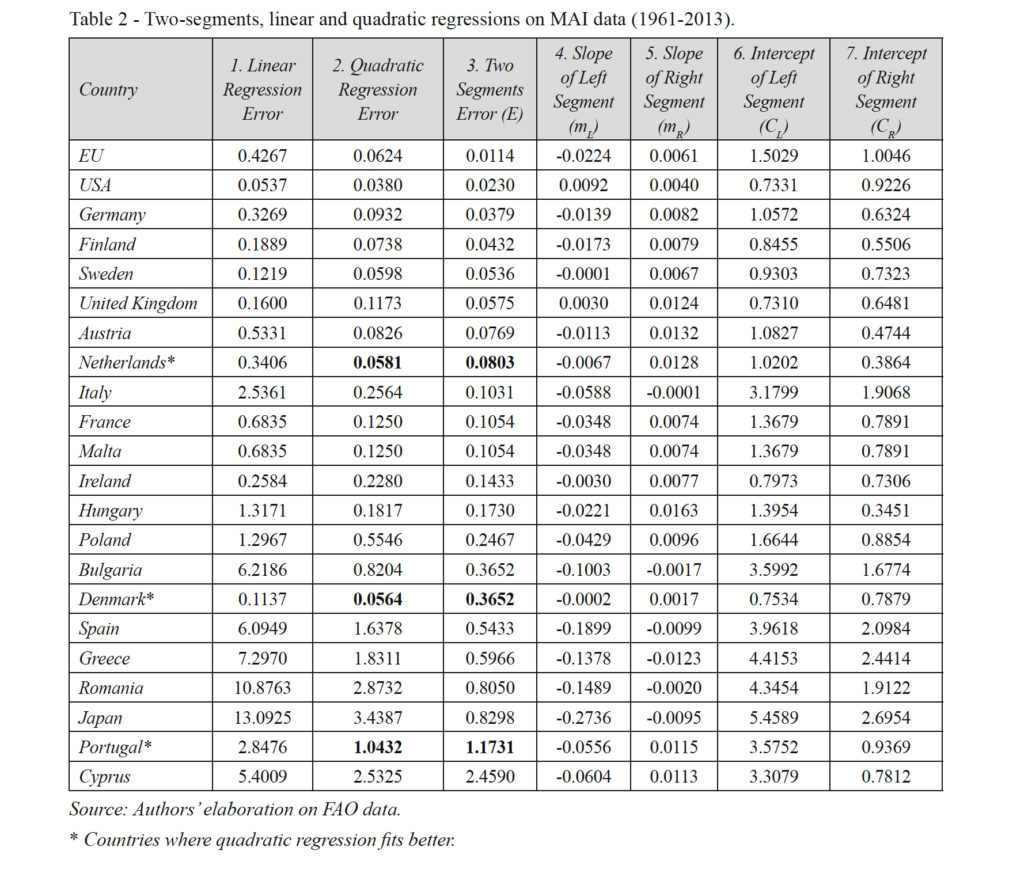
The results obtained with the linear, and quadratic regressions and the technique of the two regression segments described above are enclosed in the following Table 2.
In the first three columns of Table 2 after the Country column, the quadratic errors obtained with simple linear regression, quadratic regression of the whole series, and the technique of two regression segments (splitting the series in two periods), respectively, are displayed as the result of the application of the techniques described in the Methods. In almost all cases (except Denmark), the two-segment regressions have a smaller error (Two Segments Error – column 3) compared to that obtained with a single regression line, performed on the data of the whole period 1961-2013 (Linear Regression Error-column 1). This is the second level of threshold used in compliance with RBT. There are only three countries (Denmark, the Netherlands and Portugal) for which the error (Quadratic Regression Error – column 2) obtained with the quadratic regression (rather than linear one) is lower than that of the two segments-linear regression. For these three countries, the minimum found is in the years 1979, 1987, and 2015, respectively, but they are not turning-point years. No validation of radical change in the trend is confirmed. In the last 4 columns, the angular coefficients and the intercepts of the two regression lines on the left and on the right of the turning year have been made available (Table 2).
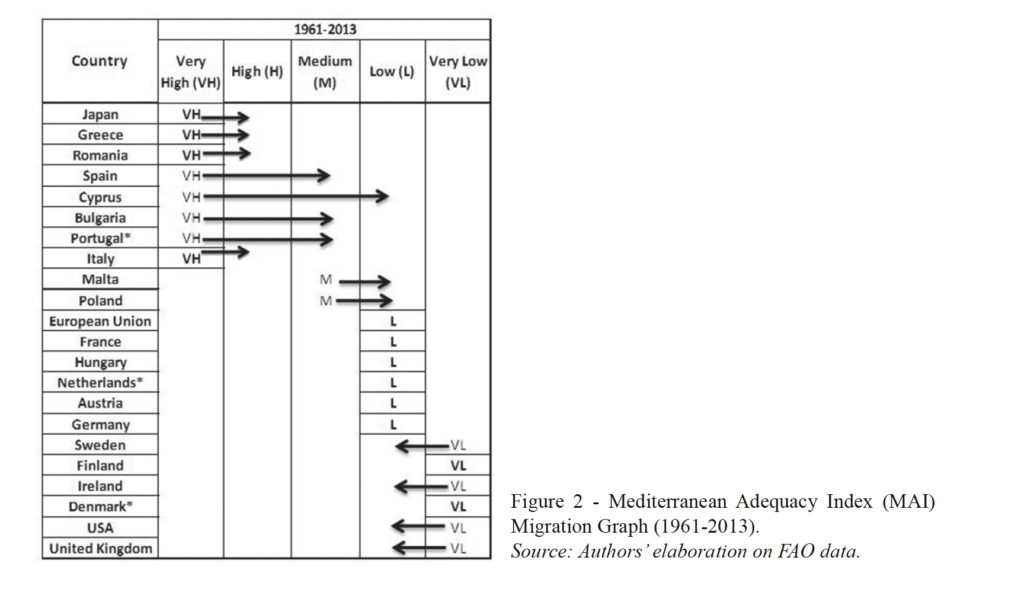
Subsequently, according to RBT method, five categories of MAI has been defined by establishing the following third level ranges of thresholds: Very High (VH) MAI≥3.0, High (H) 1.8≤MAI<3.0, Medium (M) 1.5≤MAI<1.8, Low (L) 1≤MAI<1.5, and Very Low (VL) MAI<1.
The Figure 2 represents the migration of MAI from 1961 to 2013 in the whole period independently from the turning-points and indicates the direction of long-time trend for each country (Korte, B. and Oberhofer, 1971). An arrow right-oriented means a decreasing of the MAI that may be considered by RBT a “dysfunctional” trend, while a left-oriented arrow indicates a rising of MAI and thus a “functional” trend. The migration from a category with an higher to another with lower MAI reflects an idiosyncratic behavior in eating habits that makes it harder to achieve the WHO targets, and indicates a shift away from a good for health standard diet. The opposite is the consequence of a healthy or non-idiosyncratic behavior in eating habits in tune with WHO objectives.
On consequence, the presence of a trend corresponding to a non-idiosyncratic versus an idiosyncratic dynamic behavior (with consequence of MAI increasing or decreasing) may be considered respectively a systematic tendency towards the achievement or less of the WHO objectives.
From a static point of view, countries have been classified at the beginning of the period, considering their MAI values as idiosyncratic and non-idiosyncratic by RBT: “L” and “VL” positions have been assumed to be idiosyncratic while “VH”, “H” and “M” non-idiosyncratic. From a dynamic point of view, a trend moving towards higher MAI positions is considered non-idiosyncratic (functional) while a trend moving towards lower MAI positions is considered idiosyncratic (dysfunctional) from a politically point of view.
From Table 2, Figure 2 and especially Graph 1, four categories of eating habits are detected considering the transformations suggested by the analysis of the two MAI trends, established by the two lines slopes, before and after the Turning-point and the final level of the Mediterranean Adequacy Index.
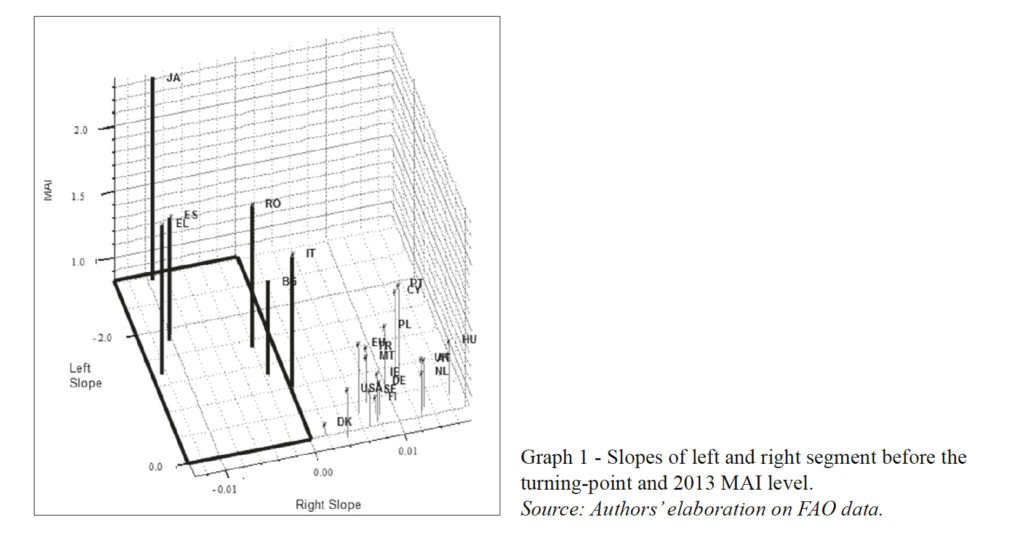
- The Cat-1 includes countries which have worsened their eating habits passing from the healthiest food style to one less good for health (from VH-MAI in 1961 to H-MAI in 2013). These countries are characterized by a first period in which the Mediterranean Adequacy Index, starting from VH values, have suffered a deep drop followed by a second period of further, but very slow, reduction (Japan, Romania, and Greece). Italy, differently, after the turning-point, has a MAI with an imperceptible decreasing but it remains however High, in the range between 3.18 in 1961 and 1.91 in 2013 (Table 1). However the MAI finally achieved in these four countries over performs the level of others, but its decreasing trend is far from stopping, and this performance does not help national health policies to achieve 2025 NCDs’ reduction targets. The MAI, starting from a non-idiosyncratic situation, developed continuously a MAI idiosyncratic trend (decreasing) in the two periods considered, although with a radical change in its slope after the turning-point (second period) in the sense of an attenuation of the decreasing trend. This behavior, according RBT terminology, assumes the characteristic of a “dysfunctional stability”. Japan, Greece and Romania have achieved their turning-points in the seventies, thus demonstrating more stable and healthy eating habits, respect Italy which turned back in 1983.
- The Cat-2 comprises countries as Spain, Bulgaria and Portugal that assisted to a worsening from an healthiest food-style to a medium-good for health food habits (from VH-MAI in 1961 to M-MAI in 2013). Their MAI, starting from Very High levels, deep collapsed and migrated to Medium one, thus favoring a real structural change towards the impoverishment of the diet. At the beginning, the MAI of these countries was very high (RBT non-idiosyncratic situation) but it has lost strongly its capacity, due to an idiosyncratic behavior, to support decision makers in achieving NCDs’ reduction targets. This happens mainly in the first period, although in the second one the negative trends greatly attenuated better than the Cat-1. Notwithstanding the trends were in both period idiosyncratic. This behavior assumes the characteristic of a RBT “dysfunctional stability” as in Cat-1. The long idiosyncratic downward trend of MAI in those countries (Cat-1 and Cat-2) has greatly attenuated after the turning-point. However this performance that is considered negative is structural and could be heavily influenced by lifestyles changes rather than by dietary habits, passing from the agro-industrial to the post-modern stage of the economy. The MAI evolution and trends in the Cat-1 and the Cat-2 of 7 out of 22 considered countries is globally the result of an idiosyncratic behavior with a negative impact on national 2025 NCDs reduction policies and voluntary targets. For this reason, their trends can led to a “dysfunctional stability” that is high for the Cat-1 and moderate for the Cat-2, and requires a deeply strengthen of their both actual and future NCSs prevention policies. The most significant declines before the turning-point have been observed for Japan followed by Spain, Romania, Greece and Bulgaria demonstrating an idiosyncratic behavior. However, the MAI of those countries remain among the highest ones. But after their turning year, only the MAI of Greece, Spain, Japan, Romania, and Bulgaria (in the downward order) have declined further although slightly. Notwithstanding, all those last countries kept their MAI in the period 1961-2013 at the top, except for Spain, Bulgaria and Portugal. In general, those two categories suffered a downsizing of Mediterranean diet with negative impacts on Mediterranean farms and food industries.
- The Cat-3 is the most crowded category with 12 countries (in addition to the EU) and refers to Inadequate food styles (from M-MAI or VL-MAI in 1961 to L-MAI in 2013). Inside of it there are six countries that have been persevering, in the first period, their old diet with a low MAI (idiosyncratic situation) and a significant weight of proteins of animal origin in food, but they reduced the negativity of this behavior with a slow increasing countertrend in the second period (non-idiosyncratic trend). These countries are the EU-complex, France, Hungary, the Netherlands, Austria, Germany and Sweden.
- Other three countries, notably Malta, Poland, and Cyprus, have reduced their MAI and worsened their food style by migration to the CAT-3 coming from the Cat-2, the first two, and from the Cat. 1 in the case of Cyprus. These last started with a non-idiosyncratic situation and performed an idiosyncratic behavior/trend in the first period followed by a non-idiosyncratic countertrend in the second period with a partial recover in the MAI level. This behavior assumes the characteristic of a “functional instability”. Cyprus MAI has literally collapsed from the Very High to the Low level, showing that this country has totally changed the food style from the Mediterranean to the Continental one, but it may be a statistic illusion due to the political division of the island in two parts, and the continuation of FAO series attributing the data to the whole island.
However, in this category there are four countries that also improve the level of the Mediterranean Adequacy Index from Very Low to Low: Sweden, Ireland, the United Kingdom and the United States. As one may note, Sweden, Ireland, the USA and the United Kingdom, which occupy MAI idiosyncratic positions, are moving toward non-idiosyncratic ones, but they didn’t pass the test for the validity of their turning-point year. This happened probably because their MAI increase has not joined a MAI level high enough to induce a turning-point, yet. This behavior assumes the RBT characteristic of a “functional stability”. They “improved” their eating habits and increased their MAI in both periods, starting from the Cat-4 and migrating upward to CAT-3. These are only four countries which at all have improved the MAI, in the whole 1961-2013 period, though of a little, changing the category. This means that their trend is unique and continuous without any stop or turning-point. This performance is understandable since their starting MAI value was Very Low already in 1961 and now went up but only to a Low level. These countries have hold, in the period 1961-2013, a non-idiosyncratic behavior and have developed trends towards more healthy eating habits, but without reaching an adequate standard.
Considering the positive sign of the angular coefficient, but small, their MAI has a slow growth. Hungary is the country with the highest growth in the second period after the turning-point although the MAI varies between 1.26 in 1961 and 1.20 in 2013: a recover after a severe drop in the first period. Sweden, Ireland, the USA and the UK despite have a Low MAI level are increasingly moving towards an improved MAI level following non-idiosyncratic trends.
However the efforts of those countries have not been enough for a significant leap forward to a healthier diet. The MAI achieved by those last countries can be defined as “open towards an improvement” that requires to be properly secured by adequate policies. Nevertheless, the Mediterranean agro-food production has been positively stimulated by the expansion of exports to these countries that are not able to produce it on their own.
- The Cat-4, in which two countries (Denmark and Finland) continue to remain immersed, and can be defined as that with the less healthy or most harmful food eating habits with a stable MAI at VL level from 1961 to 2013. The idiosyncratic situation and a non-idiosyncratic behavior and countertrend follow in the second period. Finland, which is an unstable non-idiosyncratic MAI country, had its turning-point year in 1971 and represents the country in which MAI health policies synergic effects are the lowest among the above considered countries. The reasons of this are unknown and may deserve further attention.
Finland and Denmark can be classified as having an unstable Low MAI level and follow a MAI non-idiosyncratic countertrend in the second period. This behavior assumes the RBT characteristic of a “dysfunctional stability”. For Finland the stagnant situation seems to be unblocked, despite the empirical medical studies of years ago have demonstrated the connection between the diet adopted by this country and the exorbitant number of myocardial infarcts over the average (Fidanza et al., 2004). Probably the pharmacological, medical and surgical innovations have reduced the impact of these high animal-protein and unhealthy food on the diet (and beverages), but the risk of danger persists as the MAI level is too low. Also Denmark did not passed the tests of the turning-point, but the level of the MAI remained Very Low although this country demonstrated prevalently an idiosyncratic stagnant behavior that became positive only after a certain point. But it is not clear if the parabolic shape with the upward concavity of the DK- MAI function is going to be confirmed in future. These countries give little space to expansion of Mediterranean agro-food exports.
In the Cat-3 and the Cat-4, the MAI situations were idiosyncratic but trends are globally the result of a non-idiosyncratic behavior mainly in the second period in 16 out of 22 considered countries.
Briefly, it is out of the question that MAI level is low and that the intensity of animal protein in the diet and of other not healthy food is on average increased in the 22 countries examined principally in the first period 1961-2013. There is a convergence towards a less healthy diet, and animal-protein intensive one, though in the second period after each country turning-point the majority of countries recovered a little the MAI level. Obviously the Cat-3 and the Cat-4 for the low level of MAI are the most exposed, but also the Cat-1 and the Cat-2 remain at risk and therefore subject to potential negative consequences for cardiovascular diseases due to the further forecasted decline in the MAI trend. The danger lies in the continuation of the MAI downward trend, while for most part of the Cat-3 and the Cat-4 it is necessary to support and reinforce the weak upward trend of the MAI. The agro-food policy must take into account that the worst has passed and focus on those quality products, such as olive oil, wine and raw ham required by the market, even if not in complete harmony with the Mediterranean diet.
6. Conclusions
This study represents an original attempt to verify the reliability of the trends of the Mediterranean adequacy index in 22 countries, discovering the hidden turning points, within the framework of the resource-based theory (RBT) with particular reference to its methodology based on the overcoming of three levels threshold. Such study contributes to the literature on food policy mainly in three ways: firstly, at the best state of our knowledge, no previous studies explored the hidden nature of MAI trends represented by the detection of their turning-points. Respect to Chang et al. (2017), this paper identifies “when” and “how” food styles trends change their own state of nature: from decreasing to increasing/stabilizing or to random and vice-versa. Secondly, this study establishes the year and country in which a new trend began with the greatest, or the least probability of duration and suggests as idiosyncratic food style trends can bring agricultural, food and health industries decision makers to adopt a convergent and unique innovation of product or process path (Ahuja & Katila, 2004). Previous RBT studies enlightened the role played by idiosyncratic situations such as technology exhaustion and firms’ expansion beyond national markets in helping decision makers to innovate. The interaction existing between MAI idiosyncratic trends and pre-existing MAI trends permeates the entire study and becomes the thin fil rouge connecting public health policies and Mediterranean Diet-based agricultural policies adopted in uncertain social environment conditions.
«Decision makers often make predictions and set-up their policy targets basing on trends they have observed in the past», following Hohle and Teigen (2015, p. 416). Thirdly, country based MAI idiosyncratic trends forecast a future drop in the demand for potentially healthy foods and require more effective purchase and production incentives. Similarly, they suggest an expected increase in the demand for potentially unhealthy foods and the adoption of more effective production and purchase disincentives, and vice-versa. MAI non-idiosyncratic trends suggests the excessive importance given to “kilometer-zero” from the supply side, irrespective of the healthiness of food. In this case, the danger is to fall down into the so-called “local trap”, highlighted by Born and Purcell (2006).
Moreover, new research directions emerge from the demand side. In the last decade, the growing trends in organic food sales, veganism, fresh (crude) food consumption and the shortening of supply chain are re-shaping food industry. In the future, «agro-food policies must consider both agricultural and health industries, to enable the setting up of coherent and sustainable policies, capable to benefit human health, agriculture, and the environment» (Kearney, 2010, p. 2793; Dernini et al., 2013). How, or “to what extent”, these trends can reduce MAI idiosyncratic trends? This is one of the challenges that future research will have to answer.
In the EU-27 countries, four food styles have emerged by following different trends: Mediterranean, Balkan, Mittel-Western European, and North Eastern European (Chang et al., 2017). The application of the method to detected the turning-points has succeeded for countries which follow the Mediterranean and Balkan eating habits and for Japan that registered a turning-point mainly in the seventies, deriving from a drop in MAI index, followed by a stabilization at High/Medium non-idiosyncratic levels). Also for majority of the Mittel-Western European countries the model succeeded, and the MAI evolution is weakly shaped as a bowl around the Low idiosyncratic levels of stabilization. Only three countries fit better the MAI trend with a quadratic function. For Belgium, Luxemburg, former USSR, and ex-Yugoslavia countries, a valid turning-point has been found for most countries, but the results for the other ones still remain unstable mostly due to short time series (20 years only rather than 52).
There are now 11 countries (and the EU) in the Low category of MAI, and 2 in the Very Low idiosyncratic category. They are at high risk for health and, in particular, for cardiovascular diseases. The health policies of some (eight) of these countries (Finland, Germany, Austria, Sweden, Ireland, Denmark, United Kingdom and USA), aware of the potential risk reported, have led the MAI to a slight increase in over half a century. However, these efforts are not sufficient to stem the drift towards a relatively lower level in life expectancy and higher in permanent disability, not to mention the explosion of preventable but expected public spending. Only other 4 countries reported a MAI at the top level (Japan, Greece, Romania, and Italy), and 3 at a Medium non-idiosyncratic level (Spain, Bulgaria, and Portugal), but it was also evidenced that their MAI steadily decreased from 1961 to 2013 (Alberti-Fidanza, 2004; Alberti-Fidanza and Fidanza, 2004).
Agro-food policy implications emerge, as well. Eating habits of the countries examined generally converge towards a higher intensity of animal-protein and refined food than in the past, typical of societies with mechanical mentality and industrial or post-modern lifestyle. Thus, it is possible to foresee a settlement of the agri-food production for these, especially, unhealthy products. On the contrary, the recovery trend of the MAI indicates the improvement of sales perspectives for organic and functional food productions. Trends in reducing the animal protein’s incidence in the diet begin to develop, as in veganism and as a consequence of animal welfare education, but the mass of the population is far from taking this course (Gori et al., 2017). Much of this diet-involution can be traced back to the ongoing globalization process which involves food and life styles of the population, not yet affected by trends towards the sensitivity to a healthier one. Despite high-quality public information can reduce idiosyncratic situations (Kitagawa and Okuda, 2016, 487), it can take a long time before the education comes to form individuals oriented in the aforementioned sense.
The economic crisis did not help the evolution towards more advanced food systems, based on consumer sovereignty and lifestyles that take into account the agro-food cultural heritage, and a more traditional management of the agro-food chain (Chang, Iseppi and Droli, 2015). On the contrary, the depletion of the less well-offed bands of the population has led people back on the junk food path. Final results suggest the setting up and the launch of more effective healthy food policies connected with a more consistent food chain (Chang, Droli and Iseppi, 2014).
Detecting the turning points hidden in food style trends can have a significant impact on the possibility to apply the RBT framework as well as for both NCDs’ prevention and agro-food policies. Theoretically speaking, Godfrey and Hill (1995) suggest as «theories concerned with resources should be judged both on the basis of their correspondence to reality and, most importantly, on their instrumental value as tools for generating predictions about the behavior of physical, natural and social systems» (Godfrey and Hill, 1995, p. 520). The stabilization of the eating patterns of most of the 22 countries has been tested through the study of MAI trend/countertrend before/after the turning-points and may be useful for planning new healthy eating habits. In particular, the MAI migration chart (Figure 2) indicates the convergence of 14 out of 22 countries towards a food style with a Low or Very Low Mediterranean characterization due to idiosyncratic MAI levels. This performance indicates the presence of a major obstacle, almost an iceberg, to be removed in order to allow those countries to achieve their NCDs reduction voluntary targets through targeted health policies.
Paradoxically, Japan should not follow, although the index states otherwise, a Mediterranean food pattern, but managed to maintain the highest level of the MAI after its drop with the so called “metabo” law (2008) which declared war against obesity by measuring the country’s waistline (Nandini, 2011). Thus, Japanese food and health policies have improved the effectiveness of the diet as strategic resource and dropped the obese rate of Japanese people by 1% since it started. Therefore, Japan has achieved the objective to curb part of the excess fat from society, and that example deserves to be studied for improving or then stabilizing MAI levels also in the USA, in the Mediterranean, and in other EU countries.
The above mentioned turning points may affect the way in which country-based agrofood policy targets are established and food import-export targets are assessed. Once detected, idiosyncratic turning points mean a durable drop in demand for organic and functional food supply, reducing sales opportunities for healthier food suppliers and an increasing need of both economic incentives for them as well as the adoption of disincentives for unhealthier food suppliers.
Impacts of these turning points on NCDs prevention initiatives exist, as well. For instance, the duration of the predisposition to existing healthy eating traditions influences the possibility to maintain MAI levels stably high. Decision makers being aware of high or low degree of stability of their healthy habits trends should assess their public health policies by capturing emerging opportunities or avoiding respectively incoming threats.
References
- Alberti-Fidanza A., 2004. Mediterranean Meals Patterns. Bilbl Nutr Dieta, 45: 59-71.
- Alberti-Fidanza A., Fidanza F., 2004. Mediterranean Adequacy Index of Italian diets. Public Health Nutrition, 7: 937-941.
- Alberti-Fidanza A., Fidanza F., Chiuchiù M.P., Verducci G. and Fruttini D., 1999. Dietary studies on two Italian population groups of the Seven Countries Study. Trends in food and nutrient intake from 1960 and 1991. European Journal of Clinical Nutrition, 53: 854-860.
- Balanza R., Garcìa-Lorda P., Pérez-Rodrigo C., Aranceta J., Bullò Bonet M., Salas-Salvadó J., 2007. Trends in food availability determined by the Food and Agriculture Organization’s food balance sheets in Mediterranean Europe in comparison with other European areas. Public Health Nutrition, 10(2): 168-176.
- Barney J.B., 1991. Firm resources and sustained competitive advantage. Journal of Management, 17(1): 99-120.
- Barney J.B., 2011. Gaining and Sustaining Competitive Advantage, London: Pearson, 512 pp.
- Barney J.B., Ketchen D.J., Wright M., 2011. The future of resource-based theory: revitalization or decline?. Journal of Management, 37(5): 1299-1315.
- Barringer T.A., 2001. Mediterranean diets and cardiovascular disease. Current atherosclerosis reports, 3(6): 437-445.
- Born B., Purcell M., 2006. Avoiding the local trap: Scale and food systems in planning research. Journal of planning education and research, 26(2): 195-207.
- Chang T.F.M., Droli M., Iseppi L., 2014. Does Smart Agriculture Go Downstream in the Supply Chain?. Italian Journal of Food Science, 26(4): 451-457.
- Chang T.F.M., Iseppi L., Lepellere M.A., De Lorenzo A., 2017. Food Styles and the Dynamics of the Mediterranean Adequacy Index. New Medit, 16(3): 28-38.
- Chang T.F.M., Iseppi L., Droli M., 2015. Extra-core production and capabilities: where is the Food Industry going?. International Food and Agribusiness Management Review, 18(1): 105-126.
- CIHEAM/FAO, 2015. Mediterranean food consumption patterns: diet, environment, society, economy and health. A White Paper Priority 5 of Feeding Knowledge Programme, Expo Milan 2015. CIHEAM-IAMB, Bari/FAO, Rome.
- da Silva R., Bach-Faig A., Raidό Quintana B., Buckland G., Vaz de Almeida M.D., Serra-Majem L., 2009. Worldwide variation of adherence to the Mediterranean diet, in 1961-1965 and 2000-2003. Public Health Nutrition, 12(9A): 1676-1684.
- Delgado-Lista J., Perez-Martinez P., Garcia-Rios A., Alcala-Diaz J.F., Perez-Caballero A.I., Gomez-Delgado F., Fuentes F., Quintana-Navarro G., Lopez-Segura F., Ortiz-Morales A.M., Delgado-Casado N., Yubero-Serrano E., Camargo A., Marin C., Rodriguez-Cantalejo F., Gomez-Luna P., Ordovas J.M., Lopez-Miranda J., Perez-Jimenez F., 2016. Coronary Diet Intervention with Olive oil and cardiovascular PREVention study (the CARDIOPREV study): Rationale, methods, and baseline characteristics. American Heart Journal, 177: 42-50.
- Dernini S., Meybeck A., Burlingame B., Gitz V., Lacirignola C., Debs Ph., Capone R. and El Bilali H., 2013. Developing a methodological approach for assessing the sustainability of diets: the Mediterranean diet as a case study. New Medit, 12: 28-36.
- Di Lascio M.L., Disegna M., 2017. A copula-based clustering algorithm to analyse EU country diets. Knowledge-Based Systems, 132: 72-84.
- Dillon J.L., 1971. An expository review of Bernoullian decision theory is utility futility?. Review of Marketing and Agricultural Economics, 39: 3-80.
- Estruch R., Ros E., Salas-Salvadó J., Covas M.-I., Corella D., Arós F., Gómez-Gracia E., Ruiz-Gutiérrez V., Fiol M., Lapetra J., Lamuela-Raventos R.M., Serra-Majem L., 2013. Primary Prevention of Cardiovascular Disease with a Mediterranean Diet. New England Journal of Medicine, 368(14): 1279-1290.
- Fidanza F., Alberti A., Lanti M., Menotti A., 2004. Mediterranean adequacy index: correlation with 25-year mortality from coronary heart disease in the Seven Countries Study. Nutrition, Metabolism and Cardiovascular Diseases, 14(5): 254-258.
- Finardi C., Bucchini L., and Turrini A.. 2018. Mediterranean Diet ‘reflections’. Estimating adherence to the Mediterranean diet through secondary data. Progress in Nutrition, 20(3): 344-360.
- Food and Agriculture Organization, FAO (2011). Food Balance Sheets. Document available at: http://www.fao.org/faostat/en/#search/food%20balance%20sheets, accessed on 29th February 2018.
- Garcia-Closas R., Berenguer A. and González C.A., 2006. Changes in food supply in Mediterranean countries from 1961 to 2001. Public Health Nutrition, 9(1): 53-60.
- Gautam A., Riitta K., 2004. Where do resources come from? The role of idiosyncratic situations. Strategic Management Journal, 25(8-9): 887-907.
- Girdžiūtė L., 2012. Risks in agriculture and opportunities of their integrated evaluation. Procedia-Social and Behavioral Sciences, 62: 783-790.
- Godfrey P.C., Gregersen H.B., 1999. Where do resources come from? A model of resource generation. The Journal of High Technology Management Research, 10(1): 37-60.
- Godfrey P.C., Hill Ch.W., 1995. The problem of unobservables in strategic management research. Strategic Management Journal, 16(7): 519-533.
- Gori E., Chang T.F.M., Iseppi L., Cenci Goga B., Sechi P., Iulietto M.F., Lepellere M.A., 2017. The assessment of consumer sensitivity to animal welfare: an application of Rasch model. Rivista di Studi sulla Sostenibilità, 107-127.
- Grant R.M., 1996. Toward a knowledge-based theory of the firm- Strategic Management Journal, 17(52): 109-122.
- Hart S.L., 1995. A natural resource-based view of the firm. Academy of Management Review, 20: 986-1014.
- Heinberg R., Bomford M., 2009. The Food and Farming Transition: Toward a Post Carbon Food System, Sebastopol (CA): Post carbon Institute USA. Document available at: http://www.postcarbon.org/publications/food-and-farming-transition/ accessed on 31 October 2018.
- Helfat C.E., Lieberman M.B., 2002. The birth of capabilities: market entry and the importance of pre-history, Industrial and Corporate Change, 11(4): 725-760.
- Hitt M.A., Beamish P., Jackson S.E., Mathieu J.E., 2007. Building theoretical and empirical bridges across levels: Multilevel research in management. Academy of Management Journal, 50(6), 1385-1400.
- Hohle S.M., Teigen K.H., 2015. Forecasting forecasts: The trend effect. Judgment and Decision making, 10(5): 416-428.
- Hongqiang Y., Jinghui H., Mingfang Y., 2005. Study on growth and development of Lilium×formolongi seedling. Journal of China Agricultural University, 10(1): 30-33.
- Hoopes D.G., Madsen T.L., 2008. A Capability-Based View of Competitive Heterogeneity. Industrial and Corporate Change, 17(3): 393-426.
- Kearney J., 2010. Food consumption trends and drivers. Philosophical Transactions of the Royal Society of London B: Biological Sciences. 365(1554): 2793-2807.
- Kitagawa N., Okuda S., 2016. Management forecasts, idiosyncratic risk, and the information environment. The International Journal of Accounting, 51(4): 487-503.
- Korte B. and Oberhofer W., 1970. Triangularizing input-output matrices and the structure of production. European Economic Review, 1(4): 482-511.
- Leonardi M., 2015. I modelli alimentari prevalenti, verso una transizione sostenibile, ENEA per EXPO 2015, Speciale III-2015, http://www.enea.it/it/seguici/pubblicazioni/pdf-eai/speciale-eneaxexpo/modelli-alimentari-prevalenti.pdf accessed on 31 October 2018.
- Molloy J.C., Chadwick C., Ployhart R.E., Golden S., 2011. Making intangibles “tangible:” A multidisciplinary critique and validation framework. Journal of Management, 37(5): 1496-1518.
- Nandini J.S., 2011. The Fat’s on Fire: Curbing Obesity in Japan, Boston University School of Public Health, document available at: https://www.bu.edu/themovement/2011/05/29/the-fats-on-fire/ accessed on 29 October 2018.
- Nicolai Foss J., 2010. Why Micro-Foundations for Resource-Based Theory Are Needed and What They May Look Like. Journal of Management, 37(5): 1413-1428.
- Ota K., 2010. The value relevance of management forecasts and their impact on analysts’ forecasts: Empirical evidence from Japan. Abacus, 46(1): 28-59.
- Palma G., Padilla M., 2012. The Mediterraneisation of food fashions in the World. In Mediterra. Paris: Presses de Sciences Po, 133-151.
- Panagiotakos D.B., Pitsavos Ch., Stefanadis Ch., 2008. Dietary patterns: a Mediterranean diet score and its relation to clinical and biological markers of cardiovascular disease risk. Nutrition, Metabolism and Cardiovascular Diseases, 16(8): 559-568.
- Penrose E.G., 1959. The Theory of the Growth of the Firm. New York: Oxford University Press, 254 pp.
- Piccinini L.C., Lepellere M.A., Chang T.F.M., Iseppi L., 2016. Structured Knowledge in the Frame of Bak-Sneppen Models. Italian Journal of Pure and Applied Mathematics, 36: 703-718.
- Schmidhuber J., and Traill W.B., 2006. The changing structure of diets in the European Union in relation to healthy eating guidelines. Public Health Nutrition, 9(5): 584-595.
- Strauss M.E., Smith G.T., 2009. Construct validity: Advances in theory and methodology. Annual Review of Clinical Psychology, 5(8): 1-25.
- Tang K., 2010. A Method Based on Prosperity Diffusion Index to Distinguish Turning Point of Financial Cycle. Shanghai Finance, 9.
- Teece D.J., Pisano G., Shuen A., 1997. Dynamic capabilities and strategic management. Strategic Management Journal, 18(7): 509-534.
- Tóth M., Lancaric D., Piterková A., Savov R., 2014. Systematic risk in Agriculture: A case of Slovakia. Agris on-line Papers in Economics and Informatics, 6(4): 185.
- United Nations Educational, Scientific and Cultural Organization – UNESCO, Mediterranean diet, document available at: https://ich.unesco.org/en/RL/mediterranean-diet-00884, accessed on Oct. 27, 2018.
- Wang W., Wan Y., 2012. Lewis Turning Point, Arable Land Judgment and Management of Agriculture New Thinking. Research of Agricultural Modernization, 3(011).
- Wernerfelt B., 1984. A resource-based view of the firm. Strategic Management Journal, 5(2): 171-180.
- World Bank, 2017. World Health Statistics, Cause of death, by non-communicable diseases (% of total). Document available at https://data.worldbank.org/indicator/SH.DTH.NCOM.ZS?view=chart accessed on October, 31, 2018.
- World Health Organization, 2013. Global action plan for the prevention and control of noncommunicable diseases 2013–2020. Document available at: http://apps.who.int/iris/bitstream/handle/10665/94384/9789241506236_eng.pdf?sequence=1, accessed on October, 29, 2018.
- World Health Organization. “Cardiovascular diseases (CVDs)” Accessed October, 17 2017. http://www.who.int/mediacentre/factsheets/fs317/en/ accessed on October, 29, 2018.
- Zeist A.R., Resende J.T.V., Silva I.F.L., Oliveira J.R.F., Faria C.M.D.R., Giacobbo C.L., 2017. Agronomic characteristics of tomato plant cultivar Santa Cruz Kada grafted on species of the genus Solanum. Horticultura Brasileira, 35(3): 419-424.
- Zott Ch., 2003. Dynamic capabilities and the emergence of intraindustry differential firm performance: insights from a simulation study. Strategic Management Journal, 24(2), 97-125.
Appendix 1 – About the Excel solver to find a valid turning-point
Given a series of data, the method consists in evaluating at the same time two regressions lines called left and right. For the left linear regressions, sequentially, the first two points of the series of data are taken into account, the first three and so on until all the points are considered, the procedure is repeated to the right, taking into account the last two points, the last three and so on. Let a and b be the angular coefficients and the intercepts of these straight lines respectively. Also the quadratic errors of the linear regressions are calculated and denoted with E. For simplicity the formulas of the left interpolation are reported.
Obviously the index n varies from 2 to the total number of data say T. To obtain the right regression lines the index i varies instead from T-1 to T for the first straight line, from T-2 to T for the second and so on. The turning point will be identified by that index such that the sum of the errors of the respective left and right regression lines is the minimum. For example, if the turning point is 20, it means that the sum of the quadratic errors of the regression line obtained with the first 20 data and that obtained with the last T-20 data is the smallest with respect to all the other cases.
In order to obtain at the same time all the angular coefficients, the intercepts and the quadratic errors of both the left and right regressions, a series of left and right side matrices were built. They record the values of x, xx, y and xy each time so that, the sums of the columns of these matrices are the sums needed in the formulas above. The first left matrix, called P, is simply a superior triangular matrix that has 1 above the diagonal and zero elsewhere; next to it the right matrix has as elements 1 minus the respective elements of the left matrix. The other matrices are obtained by the products row by column of these two matrices with the vectors x, xx, y and xy, those on the left are denoted by PX, PXX, PY and PXY respectively.
Let’s go into more detail about the solver’s sheet (see Annex no. 1). We leave some rows at the top of the sheet that will report the final results. We start with three columns that are the initial data: the years that in our case go from 1961 to 2013, for calculation convenience they are converted, in the second column, into values X ranging from 1 to 53, 1 corresponds to 1961 and so on; the third column contain XX, X squared; the fourth Y, contains the values of the MAI in the various years. Next to these 4 columns are placed the superior triangular matrix 53×53 with 1 above the diagonal and zero elsewhere called P and next to this another matrix of the same dimension, having as elements 1-the values of the previous P matrix. The next PX matrix is obtained by making the product row by column of the matrix P with the column X. Similarly, another matrix is obtained by considering the XX column, called PXX. The same procedure is repeated with the column Y of the values of the MAI, obtaining the matrix PY, and with the values X times Y, obtaining PXY. In all the matrices, except the first one, a row is added given by the sum of the respective columns. In the same way are built the right matrices. At this point, before constructing the last matrix that contains the quadratic errors, it is necessary to calculate the angular coefficients and the intercepts of the regression lines. To do this 8 rows are built: the first, say N, contains the numbers from 1 to 53 and then from 52 to 0; in the second, third, fourth and fifth, are reported the last rows of the various previous matrices PX, PXX, PY and PXY respectively that are the sums needed in the formulas; the sixth row contains the vector of the denominators for the computation of a and b: i.e. N times XX minus the square of X; the sixth row, except the first element that is missed (it makes no sense the regression with a single point), contains the vector A of the angular coefficients of the regression lines, left and right, whose elements are given, as formula, by the products of the respective elements of the vectors N and XY minus X times Y, the whole divided by D; the seventh row contains the vector B of the intercepts of the left and right regression lines whose elements are given by the respective elements of Y times XX minus X times XY, the whole divided by D. The last pair of matrices are those of the quadratic errors E of the linear regression obtained, by the product of the matrix P with the square of the difference between the elements of Y and the elements of A times X minus the elements of B. Obviously the first element of the first row of the left matrix and the last two elements of the last row of the right matrix remains empty since regression makes no sense.
Finally, at the top of the solver sheet, for the detection of the turning point, the angular coefficients and the intercept, a1 and b1 respectively, of the left regression lines are reported for convenience in distinct rows and similarly in the rows below, shifted one position to the left are rewritten the angular coefficients and intercepts, a2 and b2 respectively, of the right regression lines, all preceded by a row containing the numbers from 1 to 53. In the fifth row is reported the quadratic error of the regression lines E1 and in the sixth row the total quadratic error Etot given by the sum of the errors of regressions of left and right obtained as the sum of the two rows of the latest matrices. The turning point is obtained as the value of x corresponding to the optimal cut error, the minimal Etot. This position is given by the maximum of the elements of an additional row that contains all zero except that corresponding to the minimum. It is obtained with the command if, i.e. if Etot is equal to the optimal cut error, we put the corresponding number of the first row (which we remember represent the year) otherwise it is set zero. In correspondence with the optimal cut position, the column highlighted in yellow shows the angular coefficients and the intercepts of the left and right regression lines in correspondence of the turning point. In the row highlighted in yellow are reported for convenience the quadratic error, the angular coefficient and the intercept of the simple linear regression for the whole data series.