Abstract
The purpose of this study is to examine the price volatilities in corn, wheat and barley markets in Turkey, and to analyze the volatility transmission across the prices of these commodities. The Baba-Engle-Kraft-Kroner (BEKK) version of the multivariate Generalized Autoregressive Heteroskedastic (MGARCH) method was used to evaluate the conditional correlations and the time variation of the volatilities of the prices of the selected products on a monthly basis. The analysis period covers the timeframe between January 2003 and August 2017. The findings of the BEKK MGARCH model provide evidence that there is a one-way, strong and permanent volatility spillover from the corn and barley market to the wheat market. In addition, the findings of the conditional correlation analysis show that the wheat and feed market interdependence has increased to this extent for the first time since the global crisis. The results reveal that monitoring the livestock and feed policies in order to eliminate the problems in the wheat market would be beneficial. This study may be useful in designing better risk management tools for Turkish agriculture.
DOI: 10.30682/nm1803h
Gokhan Cinar*
* Department of Agricultural Economics, Faculty of Agriculture, Adnan Menderes University, Aydın, Turkey.
Corresponding author: gokhan.cinar@adu.edu.tr.
1. Introduction
Increasing volatilities in food prices will have impacts on both of the incomes of the farmers and the market stability (Enjolras et al., 2014). These volatilities may lead to uncertainty and making investment decisions that are not optimal (Guillen and Franquesa, 2015). Therefore it is important for the policymakers and risk managers to investigate the impacts and the direction of the food price volatility (Assefa et al., 2015).
Recently, this price instability situation, which is not desired in the markets, has obviously started to be experienced in the Turkish agriculture market. This instability has created inconvenient conditions regarding food security for poor people, by causing dramatic effects on the consumer budgets. The media’s intense interest in this issue has caused the policymakers to frequently respond to concerns about these rising food prices. However, no successful attempts have been made to identify and solve the cause of this volatility till today.
For the volatilities that have been experienced for a long time in the agricultural commodity markets around the world, different views such as climate change, increased demand, financial markets, and bio-fuels have been revealed (Ait Sidhoum and Serra, 2016). The most interesting one among these views is the assumption that there may be co-movements between commodity prices (Boroumand et al., 2014; Matesanz et al., 2014; Fernandez, 2015). The volatility in a market may affect other related markets (Buguk et al., 2003). Ai et al. (2006) suggested that co-movements among agricultural products may be due to the common trends of demand and supply factors in interrelated products.
In fact, while the price changes in non-agricultural products are observed at less frequent intervals, the sudden increases or decreases in prices can take place in a very short time due to reasons such as the duration of the supply, supply-demand flexibility, disease and climate conditions in agricultural products. Therefore, examining the market interactions in terms of volatility may provide a better insight into the dynamic price relationships of the markets. Despite its importance, being unable to determine the volatility interactions between the different markets with the univariate Generalized Autoregressive Condition Heteroskedastic (hereafter GARCH) models restricts the expansion of the literature in this area.
With the recently developed multivariate GARCH (MGARCH) models, it has been possible to determine the volatility across markets and to increase these practices in agricultural markets in a rapid way. Acording to this, Ceballos et al. (2016) have studied the volatility for 41 different market prices in 27 developing countries among the grain markets of the world. They found that the corn prices were more volatile than rice and wheat prices and the prices of Africa were more volatile than the prices in Latin America and South Asia. On the contrary, Rapsomanikis and Mugera (2011) determined that there is no volatility transmission across Ethiopia, India and Malawi’s world and domestic grain markets. Gardebroek et al. (2015) observed that the fluctuations in corn, wheat, and soybean prices in the United States increased particularly in weekly and monthly periods, and there was a significant volatility transmission across wheat and corn prices. Musunuru (2014) found out the evidence that there was a one-way volatility transmission from corn to wheat when the profitability rates of corn and wheat were considered. Hamadi et al. (2017) tested the level of interdependence between corn, wheat, soybean and soybean oil prices in terms of volatility spillover. According to this, while all these products have a spillover effect on each other, this effect is more towards corn and wheat markets from soybean and soybean oil. Sanjuán-López and Dawson (2017) have revealed the evidence showing that volatility spillover across the Chicago Mercantile Exchange’s dated corn, soybean and wheat markets is limited. Etienne et al. (2017) claimed that the impact of corn shocks is much greater than that of soybean, as they determined significant volatility spillover from the corn and soybean markets to the dried cereal market. Nourou (2015) showed that global poultry volatility was less than other agricultural commodities and that the volatility transmission from the prices of other commodities to the poultry prices was considerably weak. According to Guerrero et al. (2017), the volatility in chicken prices increased during the recent period of the price booms in commodities. Fakari et al. (2016) found that prices of the sheep meat in Iran were higher than beef and chicken prices and sheep meat and beef prices had a mutual volatility relationship.
When the previous studies are evaluated in general, it is observed that the price volatility in a market can be transferred to other markets, but it may vary depending on market structure, product characteristics, and country conditions.
The purpose of this study is to examine the dependence between the prices of corn, wheat and barley, which have important roles in the Turkish livestock and food sectors, in terms of their monthly volatility dynamics.
There have been significant changes in the Turkish livestock sector in recent periods. In Turkey, the share of livestock in agricultural subsidies granted by the government was 4.4% in 2002. Support at that time was usually focused on herbal products. However, in the recent period, especially ovine and bovine livestock support has been increasingly becoming the basis of agriculture policies. Within the general agricultural support, the share of support given to the livestock sector reached 24.8% in 2012, 29.7% in 2013 and 33% in 2014. At present, the livestock sector has the largest share in agricultural subsidies. Nevertheless, the number of livestock enterprises increased with the possibility of interest-free and long-term loans. In 2002, the number of bovines as 9 million 803 thousand 498 was increased to 14 million 659 thousand 278 and the number of ovine as 31 million 953 thousand 800 was increased to 44 million 572 thousand 635. Besides, even though there was no government support for the poultry farming, it has made great progress in the last decade. In fact, due to the lack of sufficient meadows and pastures for cattle in Turkey, the poultry industry was more advantageous. In 2014, the number of chickens in Turkey has reached 293 million 728 thousand. Only when compared to the previous year, a 7.8% increase in chicken meat production, 3.9% in egg production was recorded, and Turkey reached to the position of a chicken meat and egg exporter country (Republic of Turkey Ministry of Food, Agriculture and Livestock, 2015).
Despite the rapid development of these two sectors, the government has not provided sufficient infrastructure for feed requirements. As a result, market participants have faced increasingly changing feed prices. Many bovine and ovine livestock operations have come to the brink of going bankrupt due to feed prices. According to prices, the firms tried not to make a loss and tried different feed combinations, adhering to the substitutability and complementarity phenomenon of the goods in the microeconomic theory. As the price of corn increased, the producers turned to a feed ration, where wheat and barley were rather used. This situation has gradually increased the connection of the wheat market with livestock. This rapprochement is not a desirable situation for policymakers because wheat prices have a high impact on the general food prices (Baskaya et al., 2008).
Depending on these developments, the following assumptions were tested in the study. Inverse causality that depends on price ratios in the livestock sector will allow corn and barley prices to play a significant role in price fluctuations of other crops. Depending on these prices, reciprocal relations between corn, barley and wheat prices should change over time, because, the market will be sensitive to developments in the livestock sector. Especially in the recent times, when the state has increased support for bovine livestock, the volatility spread effect of the corn is expected to increase.
The spread effect between these products is of interest to market participants, including grain sellers, livestock farmers, grain producers and policymakers who want to manage the variable prices better. The research is the first attempt to quantitatively characterize the dynamic relationship of price and volatility interactions in the Turkish feed market. In addition, the study provides important contributions to the literature regarding the volatility transmission across these agricultural products that still exist in a limited way.
2. An Overview of the Cereal Products in Turkey
Table 1 presents information on cultivation area, production, yield and foreign trade for corn, barley, and wheat products in Turkey, in years. In Turkey, wheat is ranked first with a share of 67% in total cereal production areas. Barley is in the second place. Corn has a 6% share in planting areas.
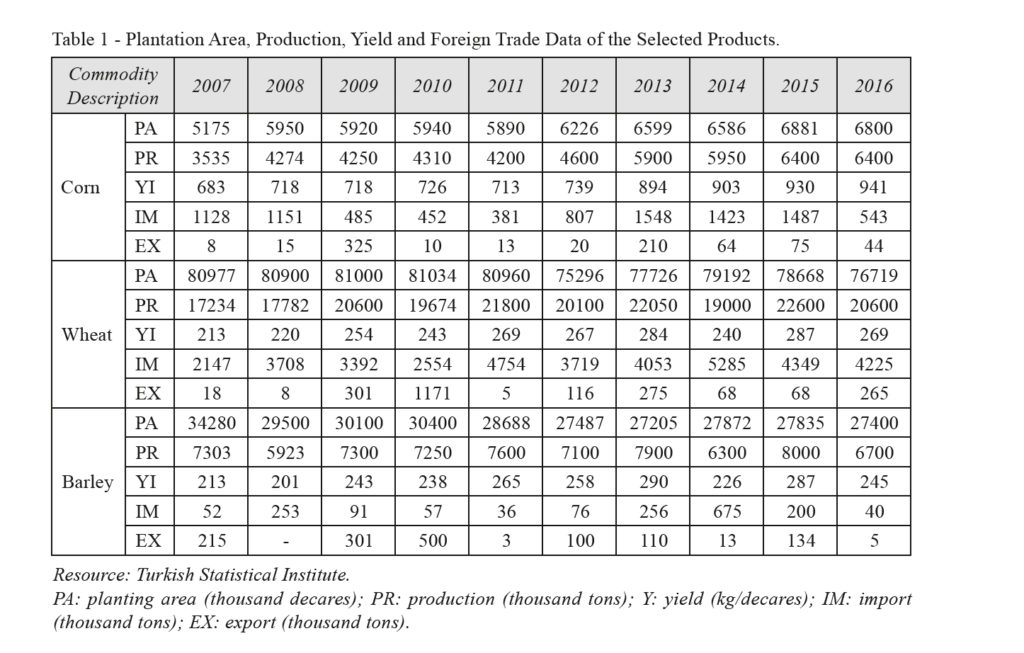
Corn cultivation areas have increased in the last 10 years. While the cultivation area was 517 thousand hectares, and the yield was 683 kg/da in 2007; in 2016, the cultivation area reached approximately 680 thousand hectares, and the yield increased to 941 kg/da. In the year 2016, corn production in Turkey was 6.4 million tons (Table 1). In the recent years, the widespread use of hybrid seeds, improvements in production techniques, and the increase in the irrigable lands have positively affected the yield of the corn. In addition, in recent years, the planting areas of the corn, which has multiple usage areas, has increased for silage production. According to the sectoral distribution of corn consumption in Turkey, the largest share belongs to the feed sector with 76%.
Wheat cultivation areas have decreased in the last 10 years. While the cultivation area was 8.1 million hectares, in 2007; in 2016, the cultivation area decreased approximately 7.6 million hectares (Table 1). Wheat consumptions during the 2015 season were: 15 million 604 thousand tons as food and 2 million 556 thousand tons as feeds (Turkish Statistical Institute, 2017). Most of the wheat was consumed as food and consumption per capita was 213 kg. On the other hand, while wheat imports were 2 million 147 thousand tons in 2007, it increased to 4 million 225 thousand tons in 2016.
When the barley cultivation areas of Turkey are examined, it is seen that the production varies between 2.7-3.5 million hectares, production is between 5.9-8.0 million tons and yield is 201-290 kg/da (Table 1). Approximately 6 million tons of this production was used as feed.
3. Data and Methods
The data used in this study consist of the monthly prices of corn, wheat, and barley for the period between January 2003 and August 2017. This period was chosen according to the appropriateness of the data. Prices of agricultural commodities have been compiled from the Turkish Statistical Institute’s online database of Agricultural Price Statistics. Prices of the products are the unit prices, which are received by the farmers and which consist of the average first hand selling prices without mediators, for the products cultivated by the farmers throughout Turkey and presented to the market. These prices are compiled from the selling prices of institutions such as trade exchanges, unions, cooperatives and the Turkish Grain Board (hereinafter TGB).
In this study, product prices are calculated in US dollars instead of Turkish liras. Even a very little relationship with the international markets provides the exchange rate volatility to be transmitted to local agricultural markets (Brümmer et al., 2016). Unlike many developing countries, in Turkey, the impact of the transitivity of the dollar exchange rate on domestic prices is extremely high (Ca’Zorzi et al., 2007).
However, the Turkish cereal sector, unlike other food products, is protected by the state (Nazlioglu and Soytas, 2011). In this regard, the TGB was assigned to organize the market. TGB is preventing the Turkish grain industry from being exposed to competitiveness in international markets. For example, in the 2006-2008 period, the prices of the agricultural products in Turkey was higher than the world prices (OECD, 2009). However, in Turkey, the substances, which constitute the largest inputs of particularly the grain production, such as especially the diesel fuel, fertilizers, medicines and seeds are met through imports. According to the data from the Ministry of Food, Agriculture and Livestock, 52 million 325 thousand 295 kg agricultural chemicals were imported in 2013. 57.9% of domestic fertilizer demand was met through imports. Seed imports have been realized as $ 194.3 million, and the most important items of these imports are hybrid corn and feed crops. In accordance with these developments, it can be stated that the US dollar value shapes the prices of grain in Turkey in terms of input costs because the basic inputs that make up the production are provided through American dollars. Therefore, presenting the prices in terms of American dollars can provide a better understanding by manufacturers, suppliers, retailers and foreign trade companies.
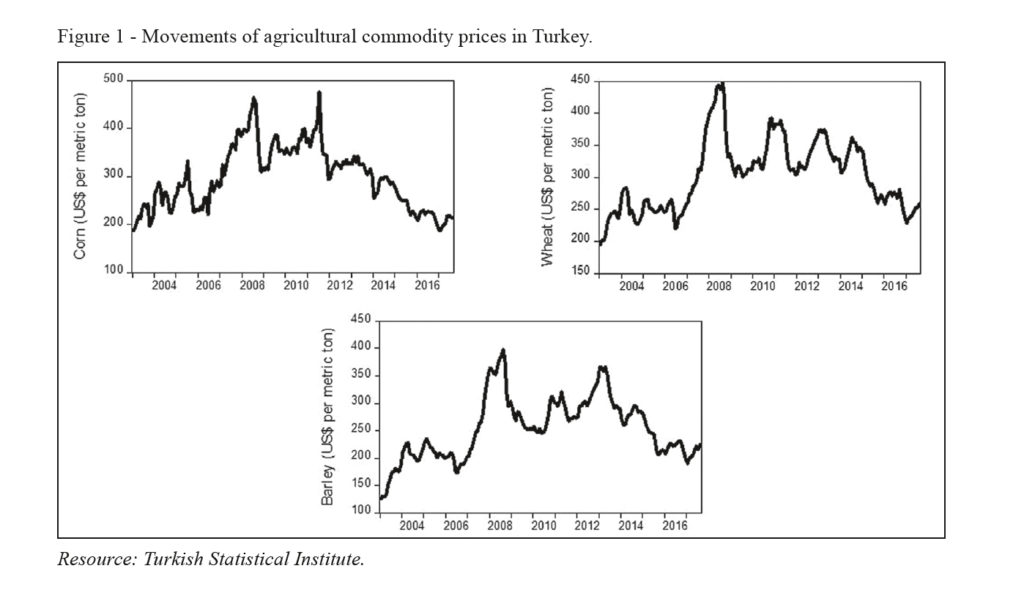
The data that are used are presented in Fig.1. When generally evaluated, it can be expressed that agricultural commodity prices, excluding corn and wheat, have a trend of declining between 2003 and 2006. It is observed that the prices increased more than two times between 2006 and 2008, which was the global crisis period; when compared to the prices of 2003. After this period, the prices have a tendency to decrease, however, the instability has continued. The price of corn and wheat in 2003 was in the range of 200 US $ per ton, while the price of barley was 125 US $. On the other hand, by the end of 2013, the prices of these three products have gone close to the same levels. After this date, especially corn and barley prices continued in a way that is considerably close to each other. In general, the increasing similarity between products’ price movements is striking. According to Fig.1, the shock in a market can be considered to affect other related markets. However, it may be misleading to interpret it depending on the figure. More advanced techniques should be used to assess the presence and direction of the volatility spillovers.
GARCH models and their various types are the methods that are widely used to assess price volatility in the market (Kalkuhl et al., 2016). The advantage of the GARCH models is that they specify the equations regarding the movements of the variances, and the MGARCH models are quite successful in predicting the co-movements. In this study, the Baba-Engle-Kraft-Kroner (BEKK) version of the MGARCH model developed by Engle and Kroner (1995) was used to investigate the effects of the price change relationships in agricultural products. Given the above specification, the BEKK (p,q) model, with the conditional covariance matrix Ht, can be represented as follows:
Where C is a (3×3) upper triangular matrix of constants with elements of cij; , which are the squared lagged errors; A is a (3×3) matrix of coefficients of aij that capture the effects of own shocks and cross-market shock interactions; and B is a (3×3) matrix of coefficients of bij that capture the own volatility persistence and the volatility interactions between markets i and j.
4. Results
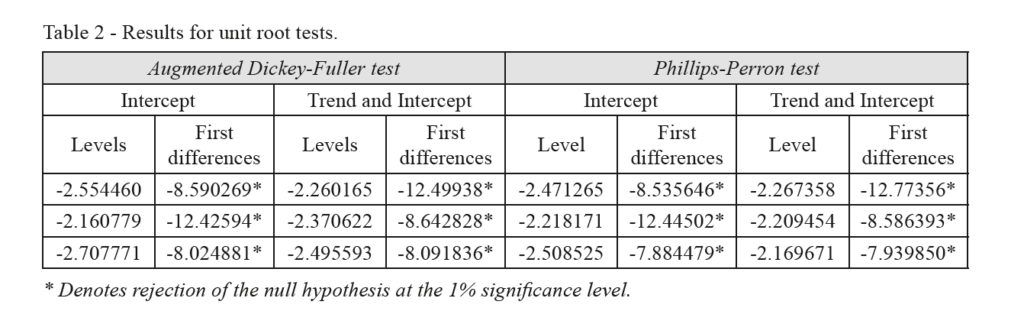
The stability test is an important step in examining the price volatility in the time series. Thus, the Generalized Dickey-Fuller and Phillips-Perron tests were applied to the data and it was determined that the variables were not stable in the level values (Table 2). Afterwards, the differences of the variables are taken from the first order. The findings of two different statistical tests show that the variables, whose differences were taken, become stable at 1% significance level.
Important tests are considered to apply the methods such as GARCH and its derivatives. These are the Jarque-Bera test, which shows the distribution of the data, the Ljung-Box test, which determines the autocorrelation, and the ARCH LM test, which shows the ARCH effects on the data. Table 3 presents the descriptive statistics of the data and the diagnostic tests that evaluate the applicability of the GARCH test. According to this, the average prices of corn and wheat are close to each other and the lowest price is at barley. Depending on the Kurtosis statistic, which is an indicator of oblateness, it can be stated that the data are inflated and the data are inclined to the left depending on the Skewness statistic. The Jarque-Bera test statistic rejects that the series is in the normal distribution, at the 5% significance level. Ljung-Box (LB) test statistics provide evidence of autocorrelation at different lags.
The rejection of the null hypothesis that there is no corelogram of residuals and squared autocorrelation indicates the presence of nonlinearity. The ARCH LM test results, which are presented in Table 3, provide evidence of the presence of the ARCH effect at the 5% significance level inside three variables. The findings indicate that the BEKK GARCH model can be applied on the data.
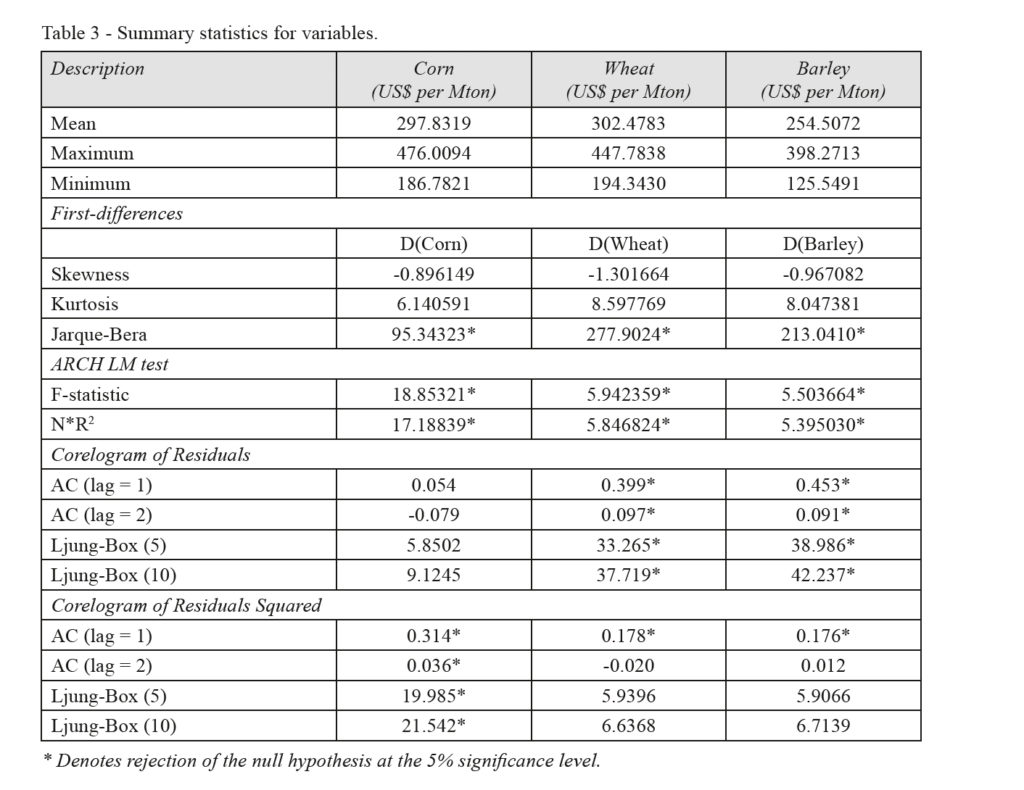
Table 4 reports the estimation results of the BEKK model. The symbols μ, δ and γ remaining in the upper part of the table are the conditional average equation coefficients and the C, which is in the middle part, is the conditional variance-covariance matrix constant. In the conditional mean equation, no relations were found in the products, except for barley, at their own lags. Similarly, statistical insignificance was also found in the C matrix. However, regarding the purpose of the research, these parameter values are insignificant.
The important ones are the A and B matrices, which represent the equilibrium conditional variance-covariance matrix coefficients. The diagonal elements in matrix A and B show their own ARCH and GARCH effects, respectively. The ARCH coefficients determine whether the volatility resulting from the markets is directly affected by shocks from their own markets or not. In other words, they predict the transmission coefficients of its market shock across the markets. The GARCH coefficients predict the persistence of long-lasting informational shocks.
In these matrices, the representation of corn price volatility is 1, the representation of wheat price volatility is 2, and the representation of barley price volatility is 3. Thus, a price volatility transmission from corn to wheat can be described as (1,2); and a price volatility transmission from the wheat to the barley can be described as (2,3). The ARCH effects on wheat have not been determined. However, there is a statistically significant volatility shock transmission (ARCH effect) towards the wheat and barley markets from the corn market. Likewise, the transfer of volatility shock from the barley market to both the wheat and corn markets is also observed. Conversely, volatility shock is not transmitted towards the barley and corn markets from the wheat market. Among these markets, the highest spillover comes from the barley market. Therefore, there is a one-way direction from the corn and barley market to the wheat market and a two-way volatility transmission across the corn and barley markets. Two-directional transmission shows that the corn and barley markets are the strong markets.
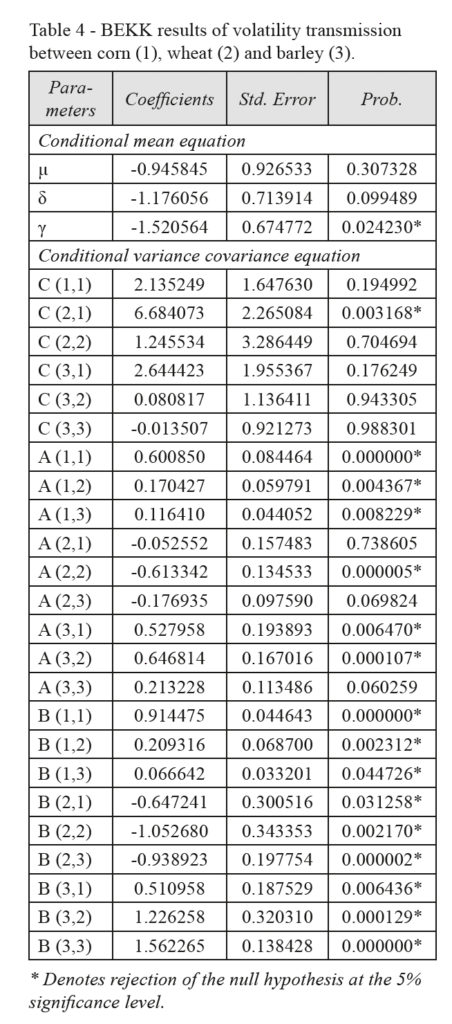
The GARCH parameters indicate that these shocks cause permanent damages. When the data are analyzed in GARCH, it is observed that the returns in three markets show a high resistance, in other words, a long time was spent to reduce the shock of the fluctuation, and that these commodities react significantly to previous information in the market.
In general, GARCH effects indicate that products are permanently affected by the previous information. Also, the ARCH effects clearly define the impact hierarchy of the barley and corn markets on wheat markets.
Table 5 presents diagnostic tests that test the validity of the model. These tests are important for the validity of the BEKK GARCH model. The model specification shows that the ARCH effects of the data are lost with the BEKK GARCH model, and the Ljung-Box Q statistics show that the autocorrelation disappears in the quadratic rotations. In addition, according to the Hosking Multivariate Portmanteau test, there is no multiple autocorrelation up to 10 lags. The log likelihood, Akaike and Schwarz criterion information criterion values are optimal. All diagnostic tests support the adequacy of the BEKK GARCH model.
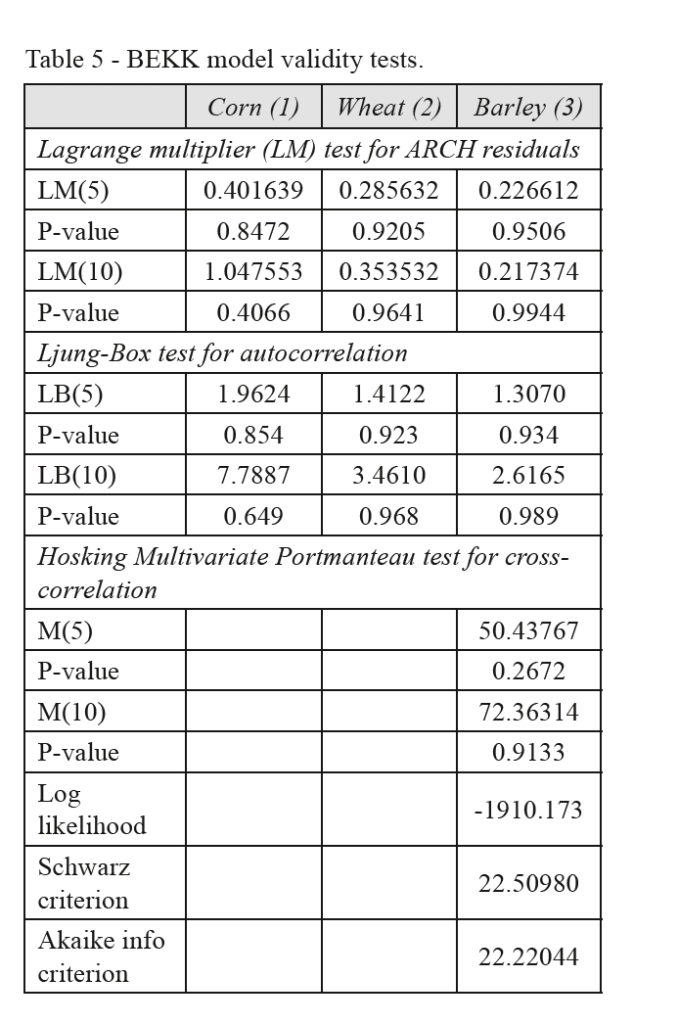
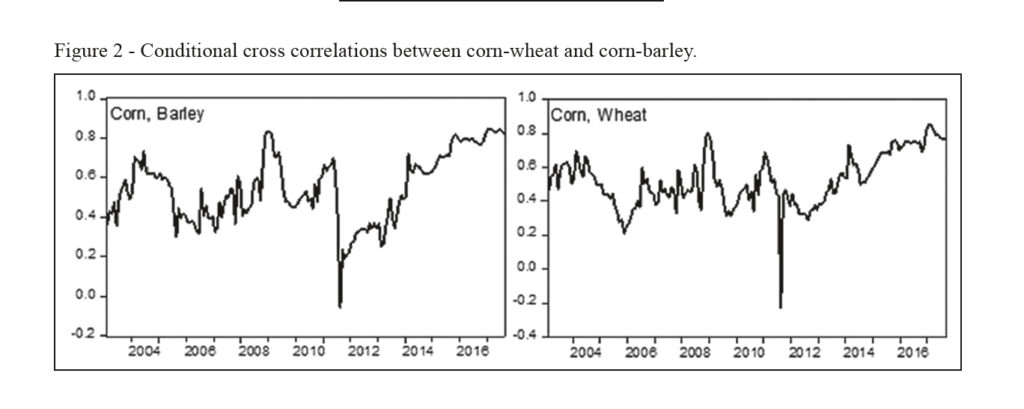
Figure 2 presents the conditional correlations between farmer prices for each commodity, depending on years. Correlation coefficients between corn-wheat and corn-barley indicate that the dynamic relationship between products has changed over time. The relationship between the two products was negative in 2011, and it was positive and strong in and after 2014. A similar situation can be seen between corn and barley prices. All of the dynamic conditional correlations between corn-wheat and corn-barley are positive, and in general, the averages involve a series of data that are larger than the value of 0.5 for corn-barley and corn-wheat. On the other hand, the recent conditional correlation coefficients of corn, both with barley and wheat, are another finding that is striking. Now, the partial correlation coefficient between these products is higher than 0.80.
5. Discussion and Conclusion
Corn, wheat and barley are the products that can be used as substitutes for each other in the livestock sector. Depending on the change in prices, farmers, who want to reduce the feed costs, can try different feed rations. Such substitution and complementarity phenomenon encourages an interdependence between markets (Saadi, 2011). Interaction in these three product markets may seem harmless. However, the wheat constitutes the basis of the Turkish nutritional habits and 66% of the daily energy intake per person is derived from these cereal products (State Planning Organization, 2003). This convergence in the animal feed market can also affect general food prices. Therefore, this situation is not preferred by the government (Baskaya et al., 2008). However, in the recent period, excessive support to the livestock sector may have provided this unwelcomed rapprochement.
In this context, in the study, the level of interdependence between corn, wheat and barley prices was tested using the BEKK GARCH method. In particular, three important pieces of evidence on volatility movements in products are addressed. The first one among these is the volatility movements in prices of products. The second is the transfer of volatility, which the prices of products have between each other. The third is whether the price of products varies with time depending on the play relationship.
Accordingly, the first important result is that product prices are affected by their own past volatility and that these shocks cause permanent damage. Markets with large numbers of small producers where the market is weak and the length of the production cycle are the facts that increase the volatility (Rezitis and Stavropoulos, 2011). Farmers, partly, give planting decisions taking future returns, current prices of inputs needed, alternative production activities and government support rates into account (Piot-Lepetit and M’Barek, 2011). Farmers plant on the basis of this information of the past, however, the harvest occurs after a period of time and until this time no sensitivity for new information will occur. The Turkish agricultural structure consists of small and fragmented land structures and family businesses. This may be the cause of high volatility for the selected products.
To overcome the structural problems that exist in the internal market requires more comprehensive policies and may take time. Enjolras et al. (2014) argue that state support to farmers having small-scale enterprises, product insurance and reducing input variability are effective policies that can be applied to control the price volatility in Italy. Also in Turkey, extending the farmers’ insurances and the measures that will be built on the input costs may help to control the market fluctuations in these items in a short period of time. In addition, the extension of the licensed warehouse can prevent grain-producing farmers from being affected by price volatility. Moreover, licensed warehousing can play an important role in overcoming marketing problems, protecting reserves, product standardization and improving the insurance system. However, in Turkey, the total available storage capacity is 681 thousand tons of agricultural products, and licensed warehousing is not yet widespread (Kayhan and Okur, 2017). The main reasons for this situation are that there’s a lack of development of the product specialized stocks and that the cost of establishing licensed warehouses are very high. Similarly, the trading volume of futures exchanges, which is used as the risk transfer method all over the world, is very low in Turkey. In the futures market, which has been in operation since 2005, only the wheat and cotton market is being traded as the agricultural products. Moreover, the manufacturers have little knowledge about futures markets. In this regard, training by stock market employees to provide more effective use of this risk protection tool can contribute to the decrease in the price fluctuation in the grain market.
The second important result is to determine the one-way volatility spread between products. This volatility has been flowing towards the wheat market. These results support the findings of Musunuru (2014). However, the Turkish grain market is isolated from the world (Nazlioglu and Soytas, 2011).
Therefore, it may be appropriate to explain this spread by domestic demand for feed. Ott (2014) predicts that the demand structure may increase the volatility, especially in grain products. Demand for agricultural products comes from consumers who use a variety of food and industrial goods obtained from raw or unprocessed farm products. However, cereals and other foods are important inputs in the livestock industry. Increases in demand for crops and oilseeds from food or biofuels processing industries or the feed processing sector increase the overall price flexibility for many agricultural commodities. More specifically, the relative increase in feed demand can sensitize cereal and protein-containing food prices against the feed grain prices (Piot-Lepetit and M’Barek, 2011). This information is consistent with the conditions in Turkey, because the one-way price spread that flows from other crops to wheat is a sign of the volatility created by the livestock sector on food prices. The feed market is important for general agricultural policies. The domestic production is not able to meet the feedstuff requirements (Report of Agriculture Assembly of Turkish Union of Chambers and Commodity Exchanges, 2018). Inadequate feed market can be tried to put into an order through imports. However, it may be worthwhile to address this topic, which was previously partly explained. In Turkey, wheat, barley and corn are the main inputs that are available after being imported from abroad. However, interestingly, direct imports of these three products are subject to different implementations by the state. These products are subject to a customs duty of 130% and then a value-added tax. This process, which is made for the protection of the producers, ensures that the import prices approach the domestic prices when entering the country. In certain periods, with the decision of the Cabinet of Ministers, the tax for TGB is reduced and cheap grain is provided. For example, the TGB, which recently regulated the market, has been given the right to import with zero tax (State Official Journal, 2017). A similar application was implemented during the global food crisis. The process is largely aimed at lowering the domestic price, lowering supply deficits and keeping the price at a stable level. As a result, Turkish grain prices can often display a different and a higher profile than world prices (TGB, 2016). In general, the input costs are very important for the Turkish grain market, which is isolated from international competition. Therefore, the impact of grain inputs on imported inputs should be reduced, or import protection should be reduced so that the grain farmers would become more open to international competition. Further research on this topic may be deemed as extremely valuable.
The last important result is to determine the changing conditional correlation between corn-barley and corn-wheat, depending on the time. The results show that there is a changing volatility correlation between corn-barley and corn-wheat depending on time. The periodic change in the dependence between crops indicates the impact of livestock policies on prices. In order to understand this change more clearly, it will be appropriate to examine the livestock policies in the period under consideration. In Turkey, at the beginning of the 2000s, the state has given more support to the farmers in crop production and animal husbandry has appeared to have a small share in the overall supports. As a matter of fact, in this period, the share of animal production in total agricultural production value was only 40%. Similarly, the correlation between corn-wheat and corn-barley volatility is also low.
Very interestingly, the correlation between products was negative in 2011. This data suggests that the two markets are responding to innovations in different ways. In this period, the state has switched to a different support system. During this production period, for the first time in Turkey, a new support system was established under the name of “production and support model for agricultural basins”. In this model, Turkey has been divided into 30 basins depending on its climate, soil and topography characteristics and in this period, firstly, the farmers who produce barley, corn, wheat, safflower, sunflower, rye, tea, rice, dried beans, canola, lentil, chickpea, cotton, soy, oat and olive oil have benefited from basin-based supports. However, this support policy was later abandoned.
Nowadays, this volatility correlation between corn-barley and corn-wheat prices is about 0.90. By the year 2016, the share of livestock in total agricultural production value increased to 56%. The main reason for this rapid increase is the government’s support for the bovine and ovine livestock sector. In particular, in recent times, a significant portion of businesses seeking to grow have benefited from subsidized livestock loans. For example, for the year 2017, under the Decree on Support for Livestock Investments, the state offers zero-interest business loans (State Official Gazette, 2017). However, this situation has led to a steady increase in the price transmissions and the demand for the animal feed and products. Spread between markets leads wheat, which is an important product of food market, to be affected by more than the feed market. Corn production has increased by 81% since 2003, while wheat cultivation areas have been steadily declining. If farmers prefer to plant forage crops, the first crop that the planting area will be reduced is wheat. In the following period, intensive support for the livestock sector in Turkey, may cause disruptions in food prices. Therefore, it may be suggested that the government design agriculture and livestock policies as a whole.
References
Ai C., Chatrath A. and Song F., 2006. On the comovement of commodity prices. American Journal of Agricultural Economics, 88(3): 574-588.
Ait Sidhoum A. and Serra T., 2016. Volatility spillovers in the Spanish food marketing chain: the case of tomato. Agribusiness, 32(1): 45-63.
Assefa T.T., Meuwissen M.P. and Oude Lansink A.G., 2015. Price volatility transmission in food supply chains: a literature review. Agribusiness, 31(1): 3-13.
Baskaya Y.S., Gurgur T. and Ogunc F., 2008. Factors Determining Processed Food Prices. Central Bank of the Republic of Turkey, General Directorate of Research and Monetary Policy, Working Paper No. 08/09, 50 pp.
Boroumand R.H., Goutte S., Porcher S. and Porcher T., 2014. Correlation evidence in the dynamics of agricultural commodity prices. Applied Economics Letters, 21(17): 1238-1242.
Brümmer B., Korn O., Schlüßler K. and Jamali Jaghdani T., 2016. Volatility in oilseeds and vegetable oils markets: Drivers and spillovers. Journal of Agricultural Economics, 67(3): 685-705.
Buguk C., Hudson D. and Hanson T., 2003. Price volatility spillover in agricultural markets: an examination of US catfish markets. Journal of Agricultural and Resource Economics, 86-99.
Ca’ Zorzi M., Hahn E. and Sanchez M., Exchange Rate Pass-Through in Emerging Markets (March 2007). ECB Working Paper No. 739. Available at: SSRN: https://ssrn.com/abstract=970654.
Ceballos F., Hernandez M.A., Minot N. and Robles M., 2016. Transmission of Food Price Volatility from International to Domestic Markets: Evidence from Africa, Latin America, and South Asia. In Food Price Volatility and Its Implications for Food Security and Policy. New York: Springer International Publishing, 303-328.
Engle R.F. and Kroner K.F., 1995. Multivariate simultaneous generalized ARCH. Econometric Theory, 11: 122-150.
Enjolras G., Capitanio F., Aubert M. and Adinolfi F., 2014. Direct payments, crop insurance and the volatility of farm income Some evidence in France and in Italy. New Medit, 13(1): 31-40.
Etienne X.L., Trujillo-Barrera A. and Hoffman L.A., 2017. Volatility spillover and time-varying conditional correlation between DDGS, corn, and soybean meal markets. Agricultural and Resource Economics Review, 1-26.
Fakari B., Aliabadi, M.M.F., Mahmoudi H. and Kojori M., 2016. Volatility spillover and price shocks in Iran’s meat market. Custos e Agronegocio Online, 12(2): 84-98.
Fernandez V., 2015. Influence in commodity markets: measuring co-movement globally. Resources Policy, 45: 151-164.
Gardebroek C., Hernandez M.A. and Robles M., 2016. Market interdependence and volatility transmission among major crops. Journal of Agricultural Economics, 47(2): 141-155.
Guerrero S., Hernández-del-Valle G. and Juárez-Torres M., 2017. Using a functional approach to test trending volatility in the price of Mexican and international agricultural products. Journal of Agricultural Economics, 48(1): 1-13.
Guillen J. and Franquesa R., 2015. Price transmission and volatility along the Spanish fresh fish market chain. New Medit, 14(1): 4-11.
Hamadi H., Bassil C. and Nehme T., 2017. News surprises and volatility spillover among agricultural commodities: The case of corn, wheat, soybean and soybean oil. Research in International Business and Finance, 41: 148-157.
Kalkuhl M., Von Braun J. and Torero M., 2016. Volatile and extreme food prices, food security, and policy: an overview. In Food price volatility and its ımplications for food security and policy. New York: Springer International Publishing, 3-31.
Kayhan F. and Okur A., 2017. Evaluating Derivatives Exchange And Those Commodity-Based Contracts Situated In This Market In Turkey. Journal of Banking and Financial Research, 4(2): 1-14.
Matesanz D., Torgler B., Dabat G. and Ortega G.J., 2014. Co-movements in commodity prices: a note based on network analysis. Journal of Agricultural Economics, 45(1): 13-21.
Musunuru N., 2014. Modeling price volatility linkages between corn and wheat: a multivariate GARCH estimation. International Advances in Economic Research, 20(3): 269-280.
Nazlioglu S. and Soytas U., 2011. World oil prices and agricultural commodity prices: evidence from an emerging market. Energy Economics, 33(3): 488-496.
Nourou M., 2015. Can Mastitis ‘Contaminate’ Poultry? Evidence on the Transmission of Volatility between Poultry and Other Commodity Prices. Factors Affecting, Global Poultry Trade. International Food and Agribusiness Management Review, 18: 183-196.
OECD, Organization for Economic Co-Operation and Development, 2009, Agricultural policies in OECD countries: monitoring and evaluation 2009, 25 pp., https://www.oecd.org/tad/agricultural-policies/43239979.pdf.
Ott H., (2014). Volatility in cereal prices: intra-versus inter-annual volatility. Journal of Agricultural Economics, 65(3): 557-578.
Piot-Lepetit I. and M’Barek R., 2011. Methods to analyse agricultural commodity price volatility. In Methods to analyse agricultural commodity price volatility. New York: Springer, 1-11.
Rapsomanikis G. and Mugera H., 2011. Price transmission and volatility spillovers in food markets of developing countries. In Methods to analyse agricultural commodity price volatility. New York: Springer, 165-179.
Report of Agriculture Assembly of Turkish Union of Chambers and Commodity Exchanges, 2018, Access, https://www.tobb.org.tr/YayinMudurlugu/Sayfalar/TOBB-Yayinlari.php.
Republic of Turkey Ministry of Food, Agriculture And Livestock, 2015, Access, https://arastirma.tarim.gov.tr/zmmae/Belgeler/Sol%20Menu/Yay%C4%B1nlar/%C3%9Clkemizde%20Zirai%20M%C3%BCcadele%20Girdilerinin%20De%C4%9Ferlendirilmesi.pdf.
Republic of Turkey Ministry of Food, Agriculture And Livestock, 2014, Access, http://tarim.kalkinma.gov.tr/wp-content/uploads/2014/10/2013-TIGEM-TOHUMCULUK-SEKTOR-RAPORU2.pdf.
Republic of Turkey Ministry of Food, Agriculture and Livestock, 2015, Access, http://www.tepge.gov.tr/Dosyalar/Yayinlar/6020b245625f400fbca5bff345086753.pdf.
Rezitis A.N. and Stavropoulos K.S., 2011. Greek meat supply response and price volatility in a rational expectations framework: a multivariate GARCH approach. European Review of Agricultural Economics, 39(2): 309-333.
Saadi H., 2011. Price co-movements in international markets and their impacts on price dynamics. In Methods to analyse agricultural commodity price volatility. New York: Springer, 149-163.
Sanjuán-López A.I. and Dawson P.J., 2017. Volatility effects of index trading and spillovers on us agricultural futures markets: a multivariate GARCH approach. Journal of Agricultural Economics, 68(3): 822-838.
State official Gazette, 2017, Access, 2017/10589 Bazı Tarım Ürünlerinin İthalatında Tarife Kontenjanı Uygulanması Hakkında Karar.
State Planning Organization, 2003, National Food and Nutrition Strategy Study Group Report, No. 2670, 40-54.
TGB, Turkish Grain Board, 2009, Access, http://www.tmo.gov.tr/Main.aspx?ID=180.
TGB, Turkish Grain Board, 2017, Access, http://www.tmo.gov.tr/Upload/Document/hububat/hububatraporu2016.pdf.
Turkish Statistical Institute, 2017, Access, http://www.tuik.gov.tr/UstMenu.do?metod=kategorist.