Abstract
Most of the countries of the south shore of the Mediterranean area face a tumultuous social and political situation arising to a large extent from poverty and sluggish growth, and this poses serious challenges also for the nations across the sea and beyond. Rapid growth and the alleviation of high unemployment and poverty are crucial to bring social and political tranquility to the region. Although there is no general theory of development, we know how these countries can achieve rapid growth and reduce high unemployment and poverty, thereby achieving social and political stability.
DOI: 10.30682/nm1803a
Dominick Salvatore*
* Department of Economics, Fordham University, New York, USA.
Corresponding author: salvatore@fordham.edu.
1. Introduction
Although the Mediterranean area is no longer a center of the world as it was during Roman times, it is still an area of great sociological, political, and economic importance. Today, most of the countries of the south shore of the Mediterranean Sea in North Africa face a tumultuous social and political situation arising to a large extent from poverty and sluggish growth. In the globalized world of today, this poses critical challenges not only for the countries of the region but also for the nations on the opposite or northern shore of the Mediterranean and beyond. Rapid growth and the alleviation of high unemployment and poverty are crucial to bring social and political tranquility to the countries of North Africa and to those across the sea.
In this paper, I will first examine the current economic situation in Algeria, Egypt, Lebanon, Jordan, Morocco, and Tunisia. Then, I will analyze how these countries can accelerate their growth and improve their standard of living, thereby achieving social and political stability, and bring to an end the uncontrolled mass migration departing from their shores and also discourage terrorism in the region.
2. The economic situation in the nations of North Africa
Table 1 shows the size (population and Gross National Income or GNI), as well as the various measures of the standard of living or wellbeing of the larger and the smaller nations of North Africa in 2016. In terms of population, Egypt is the largest nation and Lebanon is the smallest in the group of the six nations examined, while in terms of GNI Algeria is the biggest and Jordan is the smallest.
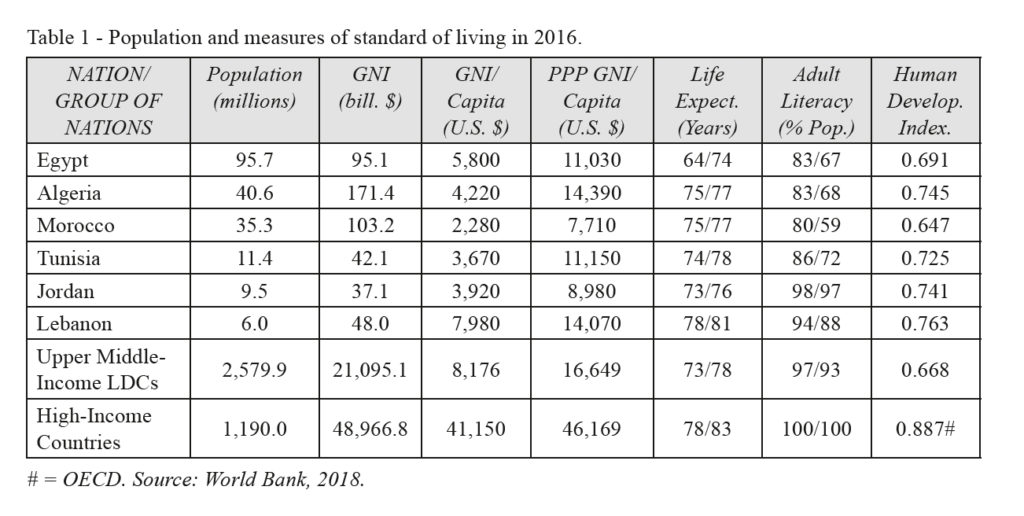
More important is the standard of living or the average degree of wellbeing in the various nations. The most used measure of the standard of living is the level of national income per capita (person). This is the highest for Lebanon ($7,980 US dollars) and the lowest in Morocco ($2,280). The weighted average of GNI per capita in all the “Upper Middle-Income Less Developed Countries or LDCs” (the status that all the nations of North Africa seek to achieve soon), is $8,176 (Lebanon is already close to that). Of course, the aim of all developing nations is to achieve the “High-Income Country” status, where the weighted average per capita income was $46,169 in 2016.
But the GNI/capita measure underestimates the real standard of living of a nation if the exchange rate of its currency with respect to the U.S. dollar (to be able to compare the GNI/capita of each nation) is below the equilibrium rate. For example, if the currency of the nation is undervalued, say, by 20 percent, then the level of its real per capita income is also underestimated by 20 percent when converted into dollars. Furthermore, the GNI/capita of the nation is underestimated by the percentage of its production which is consumed by the average family directly (i.e., that is not sold on the market). To adjust for these measurement problems, the Purchasing Power Parity per capita or PPP/per capita is used. Table 1 shows that the PPP/capita is highest in Algeria and Lebanon ($14,390 and $14,070, respectively) and lowest in Jordan and Morocco ($8,980 and $7,710, respectively), as compared to $16,640 for the Upper Middle Income LDCs and $41,169 for the High-Income Nations.
But life expectancy and adult literacy are also important indicators of the standard of living of a nation. Table 1 shows that the life expectancy (the first figure for each nation is for males and the other is for females) for the six countries under study is very similar to that of the Upper Middle Income LDCs, except for Egypt, where the males life expectancy is substantially lower than in the other five nations and for Lebanon where both values are higher than for the Upper Middle Income LDCs. The life expectancy for the High-Income Countries is still higher, but not by very much.
Table 1 also shows that the adult literacy for the six countries are substantially lower than for the Middle Income LDCs, except for Jordan and Lebanon. To be noted is that, as opposed to the situation for life expectancy, the adult literacy of the six countries is much lower for women than for men, again, except than for Jordan and Lebanon.
Finally, Table 1 shows the “Human Development Index” or HDI measure of the average standard of living or wellbeing of a nation. This combines the PPP/capita, the life expectancy, and adult literacy as a single index (weighing each of the three factors equally). According to the HDI measure, the six countries under study did better than the High Middle Income LDCs, except for Morocco. To be noted is that the difference in the PPP/capita measure of the standard of living of the six countries under study with respect to that of the Upper Middle Income LDCs is higher than for the broader measure of the standard of living provided by the HDI. To further increase the average standard of living of the six nations under study (indeed for all developing nations), however, it is crucial to increase their GNI/capita and PPP GNI/capita in the future.
3. The growth of per capita GDP and the factors affecting growth and development
When measuring growth over time the Gross Domestic Product (GDP), rather than the Gross National Income (GNI), is usually used. GNI is better for measuring the standard of living, which depends on income and consumption, while GDP is better for measuring growth because it focuses on production. The difference between the GDP and GNI is not large, however.
Table 2 shows that the average growth of real GDP from 2000 and 2016 for the six countries on the south shore of the Mediterranean in North Africa ranged from 5.2 percent for Jordan to 3.5 percent for both Algeria and Tunisia, as compared to the 5.8 percent for the Upper Middle-Income LDCs and 1.6 percent for the High-Income Countries.
But it is important to interpret and compare the difference in the growth rates between those of our six countries with those of the other two groups of countries. First, the lower is the level of the per capita income in a nation, the easier it is for the nation to start growing rapidly because the nation can copy the organizational and production techniques of the more advanced nations and take advantage of already existing technologies. Afterwards, when the nation has become more advanced, it generally becomes more difficult for the nation to continue to grow as rapidly as at the beginning of its growth and development process. This is exactly what happened first in Japan soon after World War II and afterwards to Korea and other nations, and more recently to China.
Second, we must distinguish between the growth or real GDP and the growth of real GDP per capita. If the growth of real GDP were the same as the rate of population growth in a nation over the same period the nation will have grown but not developed (i.e., its growth of real GDP per capita or standard of living will not have grown but remained unchanged). Therefore, the growth of real GDP per capita is more important than the growth of total real GDP. Table 2 shows that the average growth of real GDP per capita from 2000 to 2016 ranged from 3.2 percent for Morocco to 1.0 percent for Lebanon, as compared with 5.0 percent for the Upper Middle Income LDCs and 0.9 percent for the High-Income Countries. Note that the difference in the average rate of growth of real GDP per capita in our six countries is higher in relation to the growth of total real GDP than for the other two groups of countries because of the higher rate of population growth (not shown in Table 2) in the 2000-2016 period for our six countries than in the other two groups of countries.
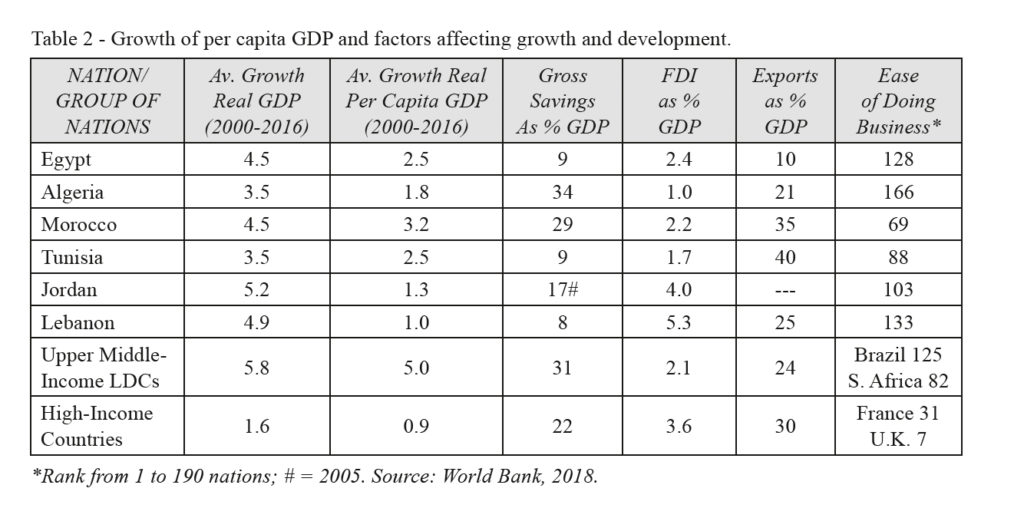
The rest of Table 2 compares four factors that are generally deemed crucial for the growth and development of a country. These are the rate of savings, foreign direct investment (FDI), and exports as a percentage of the GDP of the nation, as well as the “Ease of Doing Business” in the nation. The higher the rate of saving of the nation, the more the nation can invest in education and the training of its labor force, the more machinery it can purchase, and the more factories, hospital and schools it can build. The same is true for foreign direct investments, which also brings new technologies, as well as new and more efficient management techniques to the nation. Furthermore, the greater is the nation’s exports in relation to its GDP, the more it can specialize in the production of the goods and services in which the nation has a comparative advantage (which the nation can produce relatively more efficiently) and usually the greater is then the nation’s rate of growth and development. Finally, the easier is to do (conduct) business in a nation (i.e., the less regulated is the business life of the nation) the higher is the growth of the nation is likely to be.
Table 2 shows that Lebanon, Tunisia, and Egypt need at least to double their saving and investment rates to achieve their growth potential. Algeria and Tunisia need to attract more FDI, and Egypt must open-up its economy more to international trade. Of course, none of these things are easy to do. Finally, except for Morocco, all the other five nations of North Africa need to restructure and liberalize their economies to match at least the “Ease of Doing Business” index of South Africa (a nation in the Upper Middle-Income LDCs).
4. The Growth Report
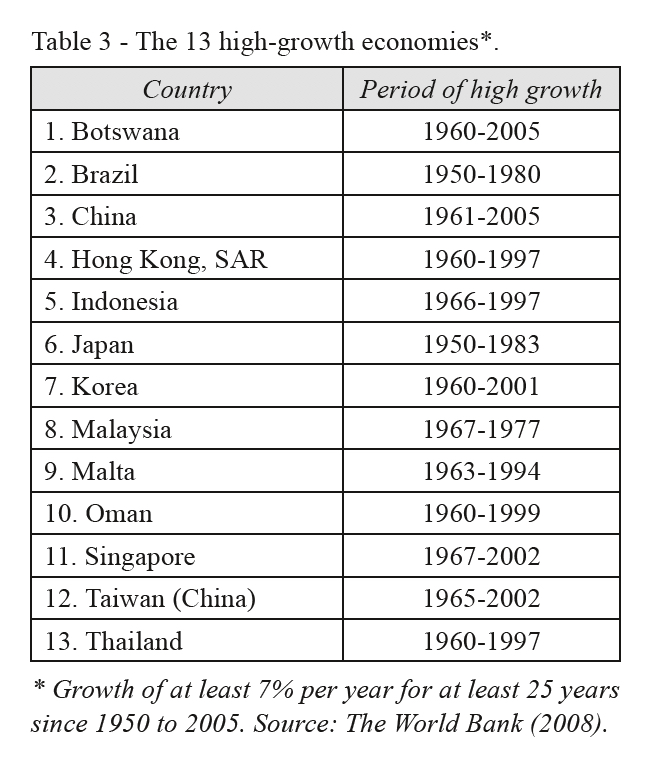
Although we do not have a general theory of economic development, we do know what factors are generally required for a developing nation to grow rapidly and develop. Four of these factors were indicated above. These and other factors were identified by the high-powered Commission on Growth and Development, in its publication, The Growth Report (2008). This provided an in-depth analysis of the common characteristics of the 13 high-growth economies during the post-war period. The high-growth countries were defined as those nations that achieved an average growth rate of real GDP of at least 7 percent per year over a period of at least 25 years from 1950 to 2005. Table 3 indicates the high-growth countries and the period when they achieved high growth, as defined above.
Although the Commission could not find any unique blueprint for ensuring high growth and development, it found that the high-growth countries shared five common characteristics. They:
1. Fully “exploited” the world economy;
2. Let markets allocate resources;
3. Mustered high rates of savings and investment;
4. Maintained macroeconomic stability;
5. Had committed, credible and capable governments.
While not specifically mentioned by name, globalization and international competitiveness seem essential characteristics embedded in a high growth strategy. Characteristics one (fully “exploited” the world economy) means globalization and characteristics two (let markets allocate resources) are two essential ingredients of international competitiveness and growth. Characteristics three is for the nation to have “high” rates of savings and investment (has discussed in the previous section). Characteristics four and five mean that the nation does not face high rates of inflation and unemployment, and they do not have very high and unsustainable budget and trade deficits (have a committed, credible, and capable government).
5. Challenges facing North African countries to achieve high growth and development
In some ways, the countries of the South shore of the Mediterranean Sea face a somewhat greater challenge in achieving rapid growth and development than today’s Upper Middle-Income Level LDCs faced in previous decades in the process of achieving their higher standard of living. This latter group of nations (Korea, Brazil, South Africa, China, and other developing countries) grew rapidly by exporting manufactured goods to advanced nations and other developing countries.
This seems more difficult to do in today’s highly globalized and interdependent world for several reasons.
First, Globalization and international trade is not expanding today as rapidly as in previous decades. Second, the production of services is growing more rapidly than the production of goods and many services and services are more difficult to export than goods. Third, China represents a most formidable competitor on international markets for today’s developing countries. Fourth, the production of most goods has become highly “fragmented”. That is, a product has many parts and components produced in different nations, and it is not easy for today’s developing countries to become part of such “value chains” of production.
Fifth, technology has greatly reduced and sometimes completely replaced the low- and medium-skilled labor (and sometimes even high-skilled labor) in the production process. For example, 3D printing or “additive manufacturing” can be used to produce almost any product by utilizing a computer model of the product for laying down successive layers of materials until the product is created – with little labor used. This is leading to “in-sourcing” or to many multinational firms bringing back to their home country the production of goods that they had previously produced in (delocalized to) some developing country to take advantage of lower wages in developing countries. Thus, it is crucially important for the countries of North Africa to acquire some of this new digital technology to become part of the value chains of production and compete in the world economy of today.
Table 4 shows the relative level of information, science, and technological knowledge that are so important for digital innovations and international competitiveness in the six countries under study. From Table 4 we see that the average percentage of the population using the Internet during the 2006-2016 period was much lower in Egypt, Algeria, and Tunisia than in the Upper Middle-Income Countries (and, of course, much lower than in the High-Income Countries). Morocco, Jordan, and Lebanon do better than Egypt, Algeria, and Tunisia (with Lebanon almost matching the level of High Income Countries).
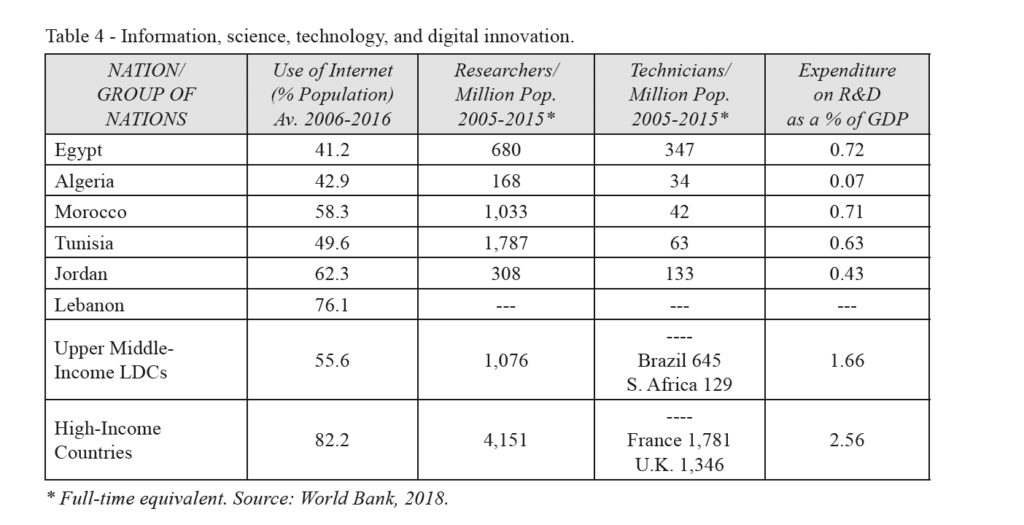
For the availability of researchers, Tunisia does better than, and Morocco does almost as well as, the Upper Middle-Income group of LDCs (but still much lower than in High Income Countries). No data was available for Lebanon. Only in Morocco was the availability of technicians higher than for South Africa (one of the Upper Middle Income LDCs – no data is available for all the Upper Middle Income LDCs). Finally, the expenditures on Research and Development (R&D) as a percentage of GDP in Jordan, Tunisia, Morocco, and Egypt was less than half that of the Upper Middle Income LDCs. For Algeria, the value was dismally low, and no data was available for Lebanon. This data indicates the improvements necessary in the countries under study to reach at least the level in Upper Middle Income LDCs in information, science, and technological knowledge to increase their digital innovations, international competitiveness, and growth and development.
6. Summary and conclusions
The countries of the south shore of the Mediterranean Sea in North Africa face a tumultuous social and political situation arising to a large extent from their poverty and sluggish growth, and this poses serious challenges also for the nations across the sea and beyond. This paper examined the policies that the countries of North Africa should adopt to achieve rapid growth and development, and reduce their high levels of unemployment and poverty, which are necessary for achieving social and political stability. Achieving rapid growth and development through industrialization and exporting, as most of today’s more dynamic developing countries followed during past decades, should be somewhat easier than in the past because the nations of North Africa can adopt already existing technologies. Other forces, however, are at work that are in fact making the process more difficult for the countries of North Africa in the globalized world economy of today.
References
Campano F. and Salvatore D., 2016. Capturing the effects of changing capital intensity on long-term growth in developing countries. Journal of Policy Modeling, 38(4): 759-765.
Commission on Growth and Development, 2008. The growth report: Strategies for sustained growth and inclusive development, Washington, D.C., World Bank.
Grilli E. and Salvatore D. (eds.), 1994. Handbook of economic development. New York, North-Holland and Westport, Conn.: Greenwood Press.
Salvatore D., 1983. A simultaneous equations model of trade and development with dynamic policy simulations and forecasting. Kyklos, vol. 26, n. 1.
Salvatore D. (ed.), 1989. African development prospects: A policy modeling approach. New York: Francis & Lewis for the United Nations.
Salvatore D., 2010. Globalization, international competitiveness, and growth. Journal of International Commerce, Economics and Policy (JICEP), 1(1): 21-32.
Salvatore D., 2018. Growth, poverty and inequalities in the age of globalization. Overland, 1(1), Forthcoming, fall.
United Nations Conference on Trade and Development (UNCTAD), 2018. Trade and development report. New York: United Nations.
United Nations, 2018. Human Development Index. New York: United Nations.
World Bank, 1993. The East Asian miracle. New York: Oxford University Press.
World Bank, 2018. World development report. Washington, D.C.: World Bank.