Abstract
This study evaluates the technical, economic and environmental results of energy exploitation from the waste of olive oil production. A case study of olive processing wastes was carried out for the fossil fuel substitution running scenario. The olive oil production plant in Turkey was investigated for a case study. The economic and financial assessment of the investment for waste utilization includes the calculation of the economic viability parameters. It was determined that the installation of a 5 MW combined heat and power production plant and electricity production is a very attractive investment. The values of discounted payback period, the net present value, the internal rate of return and the benefit to cost ratio were calculated as 3.68 years, 7,399,096 €, 30.36% and 3.43 for a combined heat and power production plant using waste from olive oil production.
DOI: 10.30682/nm1801a
Cengiz Karaca*, H. Huseyin Ozturk**
* Department of Biosystem Engineering, Faculty of Agriculture, Mustafa Kemal University, Antakya-Turkey.
** Faculty of Agriculture, University of Cukurova, Adana-Turkey.
Corresponding author: hhozturk@cu.edu.tr
1. Introduction
Biomass has been used at a wide extend for district heating in Northern Europe, and is often used at combined heat and power (co-generation) plants (Bernotat and Sandberg, 2004). The simultaneous heat and power generation reduces the primary energy consumption, compared to the independent generation of the heat and power (Hendriks and Blok, 1996), therefore making it environmentally friendlier and financially more attractive (Rentizelas et al., 2009). District heating combined with cogeneration has been used for many years now, but lately the shift towards biomass-powered cogeneration is apparent. Biomass cogeneration with district heating has not been considered a viable option for areas with warm climate up to now, as in these areas traditional cogeneration applications tend to prove financially unviable, due to the short operational time within the year (Chinese et al., 2004). Comprehensive studies have been performed by several authors regarding to management of waste from olive oil production and technical, economic and environmental assessment of energy production from biomass wastes (Lychnaras and Rozakis, 2006; Murphy and Power, 2007; Quaini et al., 2005; Rentizelas et al, 2009; Vitali et al., 2013) in different countries of all over the world.
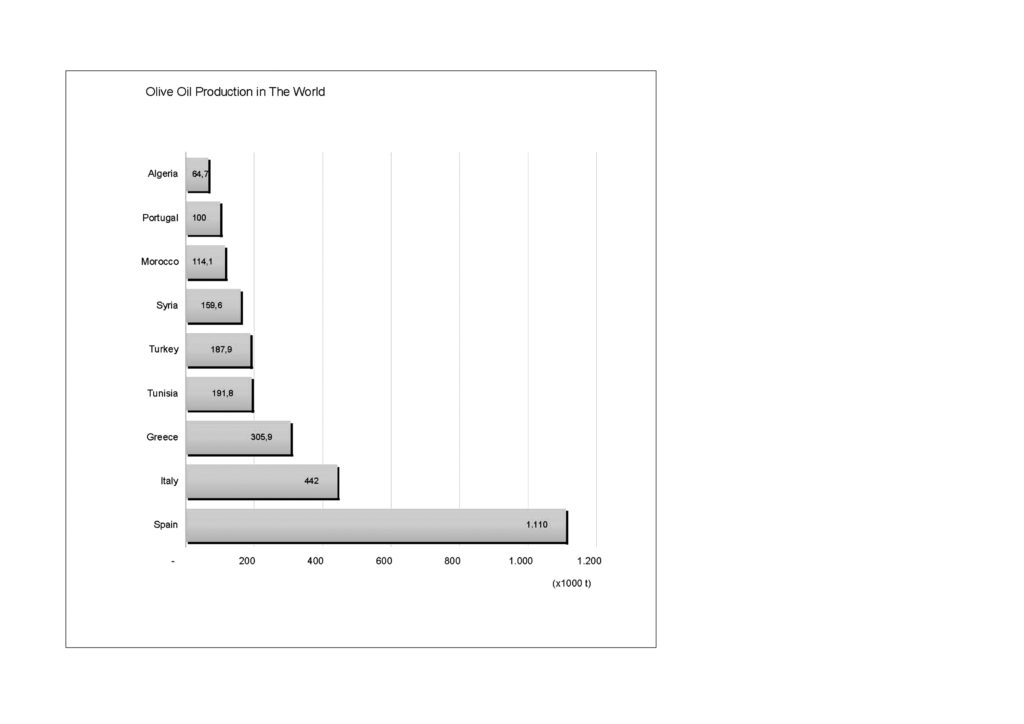
Figure 1 – The distribution of the olive oil production in the world by country.
The waste from olive oil production, which can be utilized in different ways (composting, direct combustion, etc.) has always been one of the biggest problems associated with the olive oil production industry. By-products that may result from oil extraction are: stones or pits, crude olive cake, exhausted olive cake, partly destined olive cake, olive pulp, olive pulp, and vegetable water depending on olive oil processing methods. Olive oil processing waste is known for its high energy content. Furthermore, solid by-products can be used to produce energy from oil cake material, which is an environmentally-safe waste product. Various researches showed that different types of biomass may be used as a fuel thus covering a vast range of potential energy reserves. The energy generated by the biomass combustion is primarily in the form of heat. The utilization of this energy may be implemented either directly as heat in the process or it may be transformed to provide electricity or even cooling. Different types of boiler such as steam boiler, hot water boiler, and thermal oil boiler may be associated with the combustion equipment in order to meet the specific needs of the application.
The top nine countries producing olive oil according to their production quantities in the world are given in Figure 1, respectively. Turkey is in 4th place in this order.
The amount of olive oil production, the amount of olive oil waste and its energy potential in Turkey and the district of Tarsus are given in Table 1. It is seen that the share of the Tarsus district in the olive oil waste potential of Turkey is 1.8%.
This study presents the results of Technical, Economic and Environmental (TEE) assessment of energy production from the waste of Olive Oil Production (OOP) in Mediterranean region of Turkey. In this study, one of the local companies (Boltac) located in Tarsus-Mersin, Turkey was selected for a case study. The objective of this preliminary case study is to develop a scenario and examine the feasibility of Combined Heat and Power (CHP) production from olive processing wastes. This study constitutes of the following parts; background information and description of olive processing plants, the technical options for the exploitation of these wastes in large scale and the results of the financial appraisal of a CHP plant operating with olive wastes, environmental considerations, risks and assumptions, and finally conclusions and recommendations.
|
Table 1 – Olive production for oil of Turkey and Tarsus District. |
|||
|
Olive Production for Oil (t) |
Olive Oil Waste (t) |
Energy Potential (GJ) |
|
|
Turkey |
1,286,000 |
578,700 |
10,416,600 |
|
Tarsus District |
23,217 |
10,448 |
188,064 |
2. Materials and Methods
The economic and financial assessment of the investment for biomass waste utilization includes the calculation of the economic viability parameters: Net Present Value (NPV), Internal Rate of Return (IRR), Discounted Payback Period (DPP), as well as Cash Flow Analysis (CFA) table and Investment Return Indices (IRI).
The TEE case study carried out in the following steps:
1) On-site visits to olive processing plants, face to face questionnaire, a collection of data, discussion with the company’s management and staff to identify the possibilities to exploit the potential for this waste stream.
2) Development of a scenario for the exploitation of the olive processing residues.
3) Elaboration of data, using an Excel model specifically developed for the financial appraisal of biomass investments.
4) Reporting and presentation of the results.
2.1. Technical description of olive oil production plant
Boltac olive oil production company is located between 35-38° Northern latitudes and 34−46° East longitudes in Tarsus/Mersin of Turkey. A face to face questionnaire method was applied to obtain information related to the company.
The olive oil production line in Boltac company is given in Figure 2. The continue integral system has been used to produce olive oil. The system works as follows: washing unit is composed of the conveyor, leaf cleaner, and washing sections. After the olives are delivered to the ground – level receiving hopper at the foot of defoliator by the help of the pallet system olives are conveyed to the Leaf remover used to clean olives from its leaves.
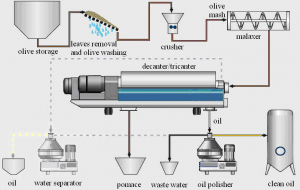
Figure 2 – The olive oil production line in Boltac company.
The transporter of defoliator is made of special rubber for to not give harms to the olives according to the international food regulation. After separation of leaves, they are conveyed to the Washing machine works with the hydro-pneumatic system. Olives are washed on the screen of the machine without giving any harm to its pulp. The foreign matters (such as particles of soil and sand) precipitate to the bottom of the sieve. With the manually controlled screw elevator, mounted on the machine, foreign particles can be discharged. Cleaned olives are sent to the crusher elevator passing through the vibration screen. Via crusher elevator with hopper, olives are transported to the crusher. Crusher and malaxer group, one of the important units of an olive oil plant, is used to crush olives and mix in order to open oil cells. Crusher is the fixed hammer type and composed by sieve and hammer components rotating at 3.000 rpm. Via hammer, olives are crushed and strike to the fixed metal cage (sieve). By this way, emulsification is largely prevented. The shoes of the hammer are made of special hardened steel. The olives are become to a semi-paste and sent to the malaxer. In this part, the semi-paste olives are distributed to the sections until become homogenous. The target is to increase the oil ratio. Inside a heating coil that circulates hot water to heat the paste to any temperature. A special type of blades made up of a double phase of pressing. Any types of super malaxer series are completely made up of stainless steel. Every section takes 750/800 kg paste. Via electronically controlled mono pump, olive paste is sent to the decanter. Mono pump is composed by rotor and stator, manufactured according to the international food regulation. In decanter unit, the paste is divided into three- phase. For recovering the oil, the machine is used the centrifugal force of using two immiscible liquids with simultaneous removal of the solids factor. The power is 3000 times greater than the gravity force. The liter of water is adjusted by the flow meter. Decanter’s type is horizontal and three-phase system. Via oil & black water pump, olive oil is sent to the resting tank and black water is sent to the needed place. Then oil is given to the separator for finishing and separation of oil from water. Separator with automatic discharging system separates mixtures of immiscible liquids with different specific gravities, with simultaneous removal of solids. The machine is equipped with a disc type bowl (6.200-6.500 rpm). The plant is controlled by the electric control panel. The primary waste fraction of the process is solid residue from decanter separation of oil from pasta. This residue consists of crushed skin, flesh, stone and water. In addition, olive oil processing waste contains some residual oil.
2.2. Properties of waste from olive oil production plant
Some of the physical properties of waste from olive oil production have been determined based on the analysis done by the company. The lower heating value of the waste from OOP was 18 MJ/kg. Moisture and ash contents of the waste were 15% and 2.5%, respectively. Another significant fuel characteristic of this residue is high alkali metal content of ash. Especially, high potassium and sodium content of ash which decreases its melting temperature lead to increased risk of ash agglomeration and deposit formation in a boiler.
2.3. Vaste management characteristics
Boltac company processed 1000 tons of olives in 2013. One ton of processed olives corresponds to 400 kg of solid olive oil production residue. The number of effective working days within a year varies from 70 to 80 days. Electricity consumption of Boltac was 3500 kWh electric in 2013 for olive oil production. Their future plan is to increase the capacity of the plant. In addition to electricity, the plant consumes process heat in order to increase the yield of olive oil by heating crushed olive cake prior oil separation.
2.4. Energy production from waste of olive oil production
The key component of the process is based on centrifugal separation of oil from heated pasta made of crushed olives. Pasta is first heated to 44°C by hot water. Boltac has invested on own hot water boiler (stoker), which is fuelled by own olive processing residue. Feeding rate of the boiler is 40 kg/h corresponding to the processing of 3 tons of olives per hour. The total production of waste is roughly 1200 kg per hour and so an excess of olive residue is roughly 1160 kg/h. Previously, this was processed to briquettes and sold for fuel of stoves of private houses but briquetting was canceled several years ago because of odor emissions. Today this excess of residue is mostly sold to other enterprises in order to recover some more olive oil by extractive processing. After this extraction residual olive waste contains approximately 1 % of the residual oil. Since summer 2014, this olive processing waste is sold further to other industry to be used as a fuel.
2.5. Technical and economical appraisal
The economic and financial assessment of the investment for biomass utilization in Tarsus includes the calculation of the annual net benefit, generated by the substitution of fuel oil from olive oil processing residues, as well as the calculation of the economic viability parameters: the NPV, IRR, DPP and BCR. The assessment has been carried out using an Excel™ model developed for the specific needs of this case study.
|
Table 2 – Input data for assessment of the scenario. |
|
|
Input |
Scenario |
|
Biomass fuel cost (including transportation cost) |
76 €/t |
|
Price of conventional fuel |
488 €/t |
|
Economic life of investment |
15 years |
|
Accounting period |
15 years |
|
Annual rate of return |
6% |
|
Tax bracket |
30% |
|
Available biomass fuel |
1.33 t/h (dry basis) |
|
Calorific value of the biomass fuel |
18 MJ/kg |
|
Technical characteristic of CHP system |
|
|
Power to heat ratio (PHR) |
0.380 |
|
Overall efficiency of CHP system |
75% |
|
Operation hours |
7,500 h |
|
Auxiliary thermal requirements |
100 MJ/h |
|
System availability |
100% |
|
Percentage of self-consumed electricity |
20% |
|
Percentage of sold electricity |
80% |
|
Heating value of the auxiliary fuel |
41.75 MJ/kg |
|
Calorific value of the conventional fuel |
38.46 MJ/kg |
|
Efficiency of the conventional system |
80% |
Input data for assessment of the scenario are given in Table 2. Input data to the assessment of the developed model can be classified as following categories:
1) eneral economic data related to the capital investment structure (equity, grants, and loans), the life cycle of the investment, the annual rate of return, etc.
2) nergy data of Boltac company (energy needs, operating hours, energy costs, etc.).
3) ata concerning the biomass system (investment cost, operating cost, efficiency, properties of fuel, etc.).
2.5.1. Discounted Payback Period
The discounted payback period (DPP) is a capital budgeting procedure used to determine the profitability of a project. A discounted payback period gives the number of years it takes to break even from undertaking the initial expenditure, by discounting future cash flows and recognizing the time value of money. The net present value aspect of the discounted payback period does not exist in a payback period in which the gross inflow of future cash flows is not discounted. The payback period is the amount of time for a project to break even in cash collections using nominal dollars. Alternatively, the discounted payback period reflects the amount of time necessary to break even on a project based not only on what cash flows occur but when they occur and the prevailing rate of return in the market. These two calculations, although similar, may not return the same result due to discounting of cash flows.
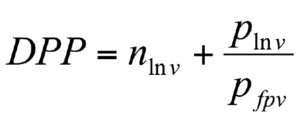
(1)
where nlnv is the number of years after the initial investment at which the last negative value of cumulative cash flow occurs, plnv the absolute value of discounted cumulative cash flow at which the last negative value of cumulative cash flow occurs and pfpv the value of discounted cash flow at which the first positive value of cumulative cash flow occurs.
2.5.2. The net present value
The net present value (NPV) or net present worth (NPW) of a time series of cash flows, both incoming and outgoing, is defined as the sum of the present values (PVs) of the individual cash flows of the same entity. NPV can be described as the “difference amount” between the sums of discounted: cash inflows and cash outflows. It compares the present value of money today to the present value of money in the future, taking inflation and returns into account. NPV is a central tool in discounted cash flow (DCF) analysis and is a standard method for using the time value of money to appraise long-term projects.
Given the period any cash flow (t, Rt) pairs where N is the total number of periods, the net present value (NPV) is given by:
 (2)
(2)
where t– is the time of the cash flow, i-the discount rate (the rate of return that could be earned on an investment in the financial markets with similar risk.); the opportunity cost of capital and Rt– the net cash flow i.e. cash inflow – cash outflow, at time t.
2.5.3. The internal rate of return
The internal rate of return (IRR) or economic rate of return (ERR) is a rate of return used in capital budgeting to measure and compare the profitability of investments. It is also called the discounted cash flow rate of return (DCFROR). In more specific terms, the IRR of an investment is the discount rate at which the net present value of costs (negative cash flows) of the investment equals the net present value of the benefits (positive cash flows) of the investment. Given a collection of pairs (time, cash flow) involved in a project, the internal rate of return follows from the net present value as a function of the rate of return. A rate of return for which this function is zero is an internal rate of return. Given the period and cash flow (n and Cn) pairs where n is a positive integer, the total number of periods N, and the net present value PV, the internal rate of return is given by r in:
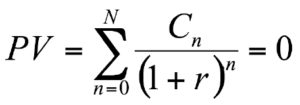 (3)
(3)
2.5.4. The benefit-cost ratio
A benefit-cost ratio (BCR) is an indicator, used in the formal discipline of cost-benefit analysis that attempts to summarize the overall value for money of a project or proposal. A BCR is the ratio of the benefits of a project or proposal, expressed in monetary terms, relative to its costs, also expressed in monetary terms. All benefits and costs should be expressed in discounted present values.
 (4)
(4)
where DVIB– is the discounted value of incremental benefits and DVIC– the discounted value of incremental costs.
2.6. Investment scenario for combined heat and power production
The case study focused on relatively small olive oil producer (Boltac) but it represents very well local olive oil producers. Most of these plants are small and therefore none of these small plants is not able to establish larger scale energy production based on own waste only. However, centralized utilization of olive oil residue from several sources could enable efficient and feasible energy production.
It is estimated that within next three years, the volume of available olive oil production waste in the surrounding (radius 90 km) of city Tarsus will be roughly 16.000 tons/year (dry matter of 10.000 tons/year considering 40% (wet basis) moisture content of olive oil processing waste). If this volume of residue is used for energy production it corresponds to 7-8 MWth (annual operation hours 7.500 h). In addition to olive oil processing residue, other agro-biofuels could be co-combusted together with olive residue in order to assure the availability of fuel and to increase the capacity of plant. Larger size enables lower specific investment and higher power production efficiency. However, it might be more difficult to find an investor to this kind of plant, which would be fuelled by agricultural residues from a large number of individual sources. Most probably no one of individual fuel suppliers will be able to invest on combined power plant but the investor should be preferably some power company or industrial company who needs process steam/heat. Therefore, we are going to examine the feasibility of use of olive processing waste for fossil fuel substitution running the following scenario: Installation of 3.6 MWth CHP plant to produce electricity for self-consumption and for selling to the network and heat for different purposes (greenhouses, district heating, olive oil process, etc.) replacing fuel oil. The size of the system has been calculated based on the available biomass in the area.
3. Results
3.1. Technical considerations
Technical characteristics of the CHP system are given in Table 3. The ratio of power to heat and the overall efficiency of projected CHP plant would be 0.38 and 75%, respectively. The output of thermal and electrical power of the CHP plant would be 3.6 MWth and 1.37 MWe. In this case, 10,275 MWh electricity and 97,200 GJ thermal energy per year could be produced in the CHP plant. While the CHP plant consumed 2,055 MWh electricity per year, 8,220 MWh electricity will be selling The electricity consumption of Tarsus is about 680 GWh in 2013 (TUIK, 2015). The salable electrical energy produced by this plant can supply 1.2 % of the total consumption of the Tarsus district. While the olive oil production plant consumed 240 GJ thermal energy per year for process heat, 96,960 GJ thermal energy can be sold in industrial facilities and especially in the greenhouse.
3.2. Economical considerations
The results of the economic assessment for the scenario are presented in Table 4. It was determined that DPP was to be 3.68 years. Payback period intuitively measures how long something takes to pay for itself. All else being equal, shorter payback periods are preferable to longer payback periods. Therefore, the scenario seems to be an economical solution due to the shortest payback period. The payback period as a tool of analysis is often used because it is easy to apply and easy to understand for most individuals, regardless of academic training or field of endeavor. When used carefully or to compare similar investments, it can be quite useful. As a stand-alone tool to compare an investment to doing nothing, payback period has no explicit criteria for decision-making (except, perhaps, that the payback period should be less than infinity). The payback period is considered a method of analysis with serious limitations and qualifications for its use, because it does not account for the time value of money, risk, financing, or other important considerations, such as the opportunity cost. Whilst the time value of money can be rectified by applying a weighted average cost of capital discount, it is generally agreed that this tool for investment decisions should not be used in isolation. Alternative measures of return preferred by economists are net present value and internal rate of return. An implicit assumption in the use of payback period is that returns to the investment continue after the payback period. The payback period does not specify any required comparison to other investments or even to not making an investment.
|
Table 3 – Technical characteristics of the CHP system. |
|
|
CHP system |
Results |
|
Available energy from biomass |
179,550 GJ |
|
Thermal energy and electricity production |
134,643 GJ |
|
The total output of the system |
18,0 GJ/h (4,970 kW) |
|
Thermal power output |
3.60 MWth |
|
Electrical power output |
1.37 MWe |
|
Energy production-Coverage |
|
|
Electricity production |
10,275 MWh/year |
|
Self-consumed electricity |
2,055 MWh/year |
|
Sold electricity |
8,220 MWh/year |
|
Thermal energy |
97,200 GJ/year |
|
Biomass and auxiliary fuel |
|
|
Auxiliary fuel |
17.96 t/year |
|
Biomass fuel |
9,975 t/year |
|
Conventional system |
|
|
Fuel for conventional system |
3,159.5 t/year |
It was calculated that the NPV was to be 7,399,096 € for the scenario. The NPV is an indicator of how much value an investment or project adds to the company. With a particular project, if the net cash flow at time t is a positive value, the project is in the status of positive cash inflow in the time of t. If the net cash flow at time t is a negative value, the project is in the status of discounted cash outflow in the time of t. Appropriately risked projects with a positive NPV could be accepted. This does not necessarily mean that they should be undertaken since NPV at the cost of capital may not account for opportunity cost, i.e., comparison with other available investments. In financial theory, if there is a choice between two mutually exclusive alternatives, the one yielding the higher NPV should be selected.
IRR calculations are commonly used to evaluate the desirability of investments or projects. The higher a project’s IRR, the more desirable it is to undertake the project. Assuming all projects require the same amount of up-front investment, the project with the highest IRR would be considered the best and undertaken first. For the present case study, it was calculated that IRR was to be 30.36%. Because the internal rate of return is a rate quantity, it is an indicator of the efficiency, quality, or yield of an investment. This is in contrast with the NPV, which is an indicator of the value or magnitude of an investment. An investment is considered acceptable if its internal rate of return is greater than an established minimum acceptable rate of return or cost of capital. In a scenario where an investment is considered by a firm that has shareholders, this minimum rate is the cost of capital of the investment (which may be determined by the risk-adjusted cost of capital of alternative investments). This ensures that the investment is supported by equity holders since, in general, an investment whose IRR exceeds its cost of capital adds value for the company (i.e., it is economically profitable).
|
Table 4 – Economic viability indices for the scenario. |
|
|
Economic viability indices |
Scenario |
|
Net Present Value (NPV) |
7,399,096 € |
|
Internal Rate of Return (IRR) |
30.36% |
|
Dynamic Payback Period (DPP) |
3.68 years |
|
Benefit to Cost Ratio (BCR) |
3.43 |
BCR takes into account the amount of monetary gain realized by performing a project versus the amount it costs to execute the project. The higher BCR is the better investment. The values of BCR were calculated to be 3.43. The general rule of thumb is that if the benefit is higher than the cost the project is a good investment. All projects or scenarios with a BCR greater than 1 could be accepted when costs and benefits are discounted at the opportunity cost of capital.
3.3. Environmental considerations
Use of biomass rather than oil for energy production results in lower levels of emissions including NOx and SOx. With inappropriate technology, bioenergy use will result in large damage to both the local environment and health. Therefore, the emissions from Boltac employing biomass burner-boiler unit to obtain energy must be filtered with an appropriate technology for the safety and preservation of the environment.
Based on the fact on this pilot case, the emission control system is not applied to the existing conventional heat production system, emission values were calculated based on the type of fossil fuel (fuel oil) substituted from biomass for the scenario. Table 5 presents data for the emissions produced when fuel oil is used in the conventional heat production system and they can be avoided by the implementation of a biomass system equipped with flue gas cleaning facilities.
4. Discussion
From an economic point of view, the CHP agro-waste fired seems to be an alternative for the development of Tarsus region. The feasibility indices of the prospective investments presented in the previous sessions are very attractive. Apart from the obvious benefit of fuel oil replacement that affects directly to the payback time, the alternatives examined before to provide an additional benefit which is the security of the energy supply and the independence from fuel price when own by-products are used for energy production.
The volume of available olive waste is limited to below 10 MWth. From a technical point of view, this limitation does not set any specific restrictions to combustion technology. Characteristics of the fuel are rather challenging especially because of relatively high alkali metal content of olive residue ash. This is a typical specific feature of many agro-biofuels and a specific attention has to be focused on avoiding of problems related to ash agglomeration and deposit formation. In addition to technical issues, selection of most suitable technology has to take account economic issues related to the capacity of plant. For example, from a technical point of view fluidized bed technology can be applied from some kWfuel to hundreds of MWfuel but the specific investment of small scale (below 10…20 MWfuel will be significantly higher than in larger scale. In most cases, the most suitable technology in small scale (below 1 MWfuel) is usually simple stoker burner. Medium-scale boilers (1-20 MWfuel) are usually based on grate firing. Grate firing is technically feasible up to 100-150 MWfuel but most of the medium to large scale (larger than 20 MWfuel) boilers are nowadays based on high efficiency and fuel flexible fluidized bed combustion technology. Based on an assessment of the volume of available olive oil processing residue in Tarsus area the most suitable technology will be based on stoker burner or grate firing.
|
Table 5 – Avoided emissions implementing scenario. (Substitution of fuel-oil flow 3 159 455 kg/year) |
|||||||||
|
Fuel |
Combustion products (Nm3/year) |
||||||||
|
Fuel analyses |
%(ob) |
Stoki. O2 |
CO2 |
SO2 |
N2 |
Argon |
H2O |
O2 |
CO |
|
%C |
84.02 |
4,955,204.9 |
4,962,300.7 |
0.0 |
18,467,895.0 |
219,968.5 |
433,549.4 |
0.0 |
0 |
|
%H |
11.31 |
2,001,072.4 |
0.0 |
0.0 |
7,457,934.7 |
88,830.4 |
4,177,226.1 |
0.0 |
0 |
|
%N |
0.50 |
0.0 |
0.0 |
0.0 |
12,637.8 |
0.0 |
0.0 |
0.0 |
0 |
|
%S |
2.73 |
60,377.2 |
0.0 |
60,377.2 |
225,023.9 |
2,680.2 |
5,282.6 |
0.0 |
0 |
|
%Water |
1.10 |
0.0 |
0.0 |
0.0 |
0.0 |
0.0 |
43,249.4 |
0.0 |
0 |
|
Total |
99.66 |
7,016,654.5 |
4,962,300.7 |
60,377.2 |
26,163,491.4 |
311,479.2 |
46,559,307.6 |
0.0 |
0 |
|
Excess air |
2,183.7 |
0 |
5,683,343.44 |
67,693.5 |
133,421.3 |
1,524,923.7 |
0 |
||
|
Gas composition %(ob) |
11.39 |
0.14 |
73.09 |
0.87 |
11.00 |
3.50 |
0 |
Currently, in Turkey, some of the olive oil wastes are used for second quality oil production. Some of them are used as heat energy in housing and industrial operations. Systems used industry for heat energy are conventional stoker burning systems. In houses, it is burned in the stove. The burning efficiency of both combustion systems is very low. At the same time, the emissions of these gases are also high. At the same time, the emissions of the flue gas produced by these two systems are high. Because these systems do not have chimney filtering equipment. Therefore, these wastes need to be professionally evaluated in modern facilities which are more environmentally friendly and more efficient.
From an environmental point of view, the CHP agro-waste fired are based on the replacement of fossil fuels. Oil usage causes significant CO2 emissions. It is well known that harmful emissions of the biomass-fired boiler are low compared to oil-fired plant when the biomass-fired boiler is equipped with relevant flue gas cleaning facilities. It has to be mentioned that the assessment of the scenario was carried out taking into consideration the cost of manufacturing and installing a biomass system which complies with the standards and the specifications of the EC and usually is provided by EU companies. However, a market survey in Turkey shows that the Turkish manufacturers and contractors are promised similar equipment on lower cost, sometimes in the half of the price offered by an EU manufacturer. It is obvious that a reduction in the capital cost leads to more attractive economic feasibility indices.
5. Conclusions
Based on the results of the techno-economic-environmental case study, it seems that the installation of a 5 MW CHP plant to Tarsus region of Turkey for substitution of fuel oil and electricity production is a very attractive investment. The feasibility indices of the prospective investments presented in the previous sessions are very attractive. Apart from the obvious benefit of fuel oil replacement that affects directly to the payback time, the alternatives examined before to provide an additional benefit which is the security of the energy supply and the independence from fuel price when own byproduct is used for energy production. From an environmental point of view, all the alternatives presented above are based on the replacement of fossil fuels. Oil use causes significant CO2 emissions. It is well known that harmful emissions of the biomass-fired boiler are low compared to oil-fired plant when the biomass-fired boiler is equipped with relevant flue gas cleaning facilities.
References
Bernotat K. and Sandberg T., 2004. Biomass fired small-scale CHP in Sweden and the Baltic States: a case study on the potential of clustered dwellings. Biomass Bioenergy, 27: 521-530.
Bohorquez W.O.I., Barbosa J.R. and Nogueira L.A.H., 2012. Operation analysis and thermoeconomic evaluation of a cogeneration power plant operating as a self-generator in the Ecuadorian electrical market and sugar industry. Journal of Energy Resource Technology, 134: 501-508.
Hendriks C. and Blok K., 1996. Regulation for combined heat and power in the European Union. Energy Conversion and Management, 37: 729-734.
Lychnaras V. and Rozakis S., 2006. Economic analysis of perennial energy crop production in Greece under the light of the new CAP. New Medit, 5(3): 29-37.
Murphy J.D. and Power N., 2007. A technical, economic, and environmental analysis of energy production from newspaper in Ireland. Waste Management, 37(2): 177-192.
Ouaini N., Medawar S., Daoud R., Ouaini R., Chebib H., Rutledge D. and Estephan N., 2005. Etat actuel des huileries d’olive au Liban: potentiel de production. New Medit, 4(4): 31-36.
Rentizelas A., Karellas S., Kakaras E. and Tatsiopoulos I., 2009. Comparative techno-economic analysis of ORC and gasification for bioenergy applications. Energy Conversion and Management, 50: 674-681.
TUIK (Turkish Statistical Institute), 2015. Seçilmiş Göstergelerle Mersin.
Vitali F., Parmigiani S., Vaccari M. and Collivignarelli C., 2013. Agricultural waste as household fuel: Techno-economic assessment of a new rice-husk cookstove for developing countries. Waste Management, 33(12): 2762-2770.