Abstract
The study focuses on the “curse of resources” and on the “paradox of plenty”, to test the extent to which the oil-export may contribute to the food dependency and to the food insecurity of a country. The empirical analysis is carried out in countries characterized by a percentage of oil contribution to the GDP between 45% to 90% meanwhile facing food security challenges. The estimated model shows the sizable and statistically significant impact of oil export on food import and undernourishment. The analysis is further extended to the tails implementing, besides OLS, the quantile regression estimator.
DOI: 10.30682/nm1904d
Abdallah Djella*, Luigi Cembalo*, Marilena Furno*, Francesco Caracciolo*
* Department of Agricultural Sciences, Agricultural Economics and Policy group – University of Naples, Federico II, Italy.
Corresponding author: abdallah.djella@unina.it
Cite this Item: Djella A., Cembalo L., Furno M., Caracciolo F., Is oil export a curse in developing economies? Evidence of paradox of plenty on food dependency, New Medit, 18 (4): pp. 51-64, http://dx.doi.10.30682/nm1904d
1. Introduction
The growing literature on the “curse of resources” and on the “paradox of plenty” (Auty, 1993; Karl, 1997) has generated significant causal claims that link the abundance of resources with corruption, authoritarianism, economic decline and violent conflicts (Sachs and Warner, 2001). The present study adds to this strand of literature.
From a pure economic perspective, earlier economists such as Adam Smith and David Ricardo considered the natural resources beneficial for economic development: availability of natural resources are considered trigger of any socio-economic development, significantly affecting foreign capital inflow and the development of raw materials and manufactured inputs markets (Mikesell, 1997).
After the decline of the Dutch manufacturing sector, linked to the discovery of a natural gas field in the Netherlands, the so-called “Dutch disease” (Corden and Neary, 1982), several studies investigated the negative impact of the natural resources on economic growth, identifying the existence of the paradox. After this circumstance, several studies associated this theory to the developing rich-resources countries, especially, the middle east, Africa and Latin America nations. The counterexample is provided by the East Asian economies (i.e. Japan, Korea, Taiwan, and Singapore) that are not rich-resources countries and grow faster than other similar countries. Moreover, oil-dependent states appeared economically unstable, authoritarian and tormented by conflicts (Gary and Karl, 2003; Collier and Hoeffler, 2004; Sala-i-Martin and Subramanian, 2013). For instance, Tsui (2011) observed how developing oil-rich countries neglect the non-oil industry. Consequently, these systems tend to have stagnant economies and are particularly vulnerable to price fluctuations of oil products (Tornell and Lane, 1999; Okpanachi, 2011). These structural problems are worsened by the high rates of population growth across the world, as well as by persistent corruption and clientelism that accompany the oil-financed patronage (Sala-i-Martin and Subramanian, 2013).
Besides, the lack of economic growth causes the growth in unemployment and poverty that form the basis of a destabilizing widespread discontent (Collier and Hoeffler, 2004). Another long-term socio-economic challenge for oil-dependent countries is the reduced expenditure on education in terms of percentage of gross domestic product (Karl, 2007). Given the available resources, the returns from education are generally worse than expected, affecting future growth potential: indeed, the richness of the natural resource endowment that leads to short-term revenue mined the overall system of incentives for human resources development that in opposite requires long-term investments (Karl, 2007; Lam and Wantchekon 2003).
Besides, several studies provided empirical evidence on the negative impact of natural resources – oil and minerals – on the overall country development, influencing the institutions quality (Sala-i-Martin and Subramanian, 2013). To the best of our knowledge this is the first study that looks at “the curse of resource” and its potential impact focusing specifically on food import and undernourishment. This research starts from the evidence that several oil-rich countries depend on oil revenue to import necessary goods, food included. Since these countries do not invest in agricultural sector, they may fail to reach a sustainable food security (Tsui, 2011). Moreover, given the carelessness towards non-oil sectors such as agriculture, oil-rich governments are forced to allocate more and more resources to increasingly expensive imports, thereby limiting their ability to finance mechanisms of stabilization of social spending. In addition, the oil revenues volatility has a direct and close impact on agricultural investments, while food production, particularly in semi-arid and desert areas, is increasingly suffering water scarcity and high temperatures, finally affecting commodities prices and the purchasing power of millions of people (Caracciolo et al., 2014). Thus, the objective of this study is to test the extent to which, under specific macro context, the oil and gas resources richness (oil-export) may contribute to the food dependency (food import) and to the food insecurity (undernourishment). The empirical analysis is carried out in some food insecure oil exporting countries, sharing macroeconomic similarity with respect to oil dependency and socio-economic conditions. The six countries analyzed in this paper are: Qatar, United Arab Emirates, Saudi Arabia, Angola, Nigeria, and Algeria. Within the Africa and Middle east area, these countries are characterized by a percentage of oil contribution to the GDP between 45% to 90%, and face food security challenges, since they are continuously exposed to oil price volatility and, in the long run, to possible oil scarcity. The estimated model allows to deepen the analysis of food import dependence and undernourishment in these countries, showing the sizable and statistically significant impact of oil export. The analysis is further extended to the tails of both the food import distribution and the undernourishment one. The remainder of the paper is organized as follows: In Section 2 both agricultural and oil sector for the six countries are briefly summarized. Section 3 illustrates the empirical approach, while Section 4 presents the estimated results. Section 5 concludes the study with a discussion of the main findings and of the limitations of this study.
2. Brief overview of the six countries
Our study focuses on six specific countries within the Africa and Middle East area. The countries here considered are characterized by similar macroeconomic and industry-specific dynamics such as high revenue from hydrocarbon exports and external food dependency.
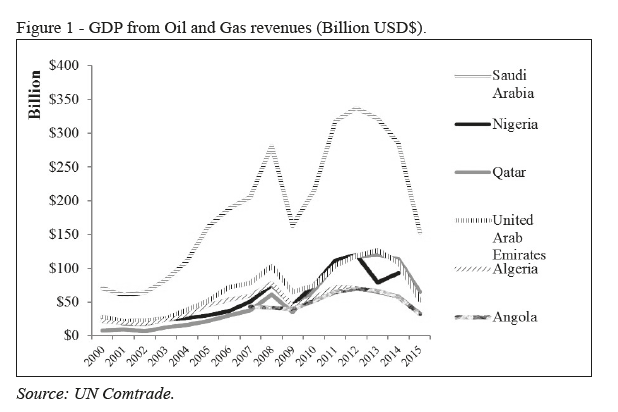
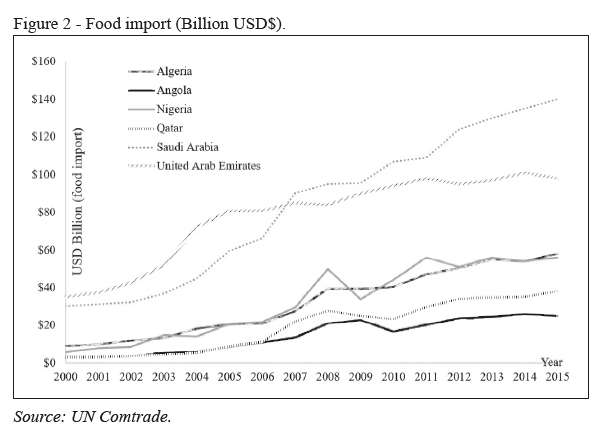
Figure 1 shows the similar trend of hydrocarbons revenues in the six states which in turn closely resembles the food imports trend of Figure 2: a stronger interrelation between oil revenues and food import can be observed particularly after the fuel shock price in 2014 when oils revenue and food import both decreased sharply. This implies that, at least apparently, food availability is closely related to hydrocarbons revenues. A brief overview of the current situation of each country is presented in the following paragraphs. The data set here analyzed has several different sources: trade statistics from Comtrade records; macroeconomics indicators are sourced from IMF – World Economic Outlook Database, while development statistics are from the World Bank open data.
2.1. Qatar
With a population of about 2.32 million, Qatar is the first gas producer in the world and has the third largest gas reserve in the world. The economy is very dependent on hydrocarbon income, which represents 61% of GDP, 95% of total exportation and 75% of government budget (Gardan, 2013). Lately the non-hydrocarbon GDP increased passing to 55% of GDP in 2011. In 2016, the gas price decline had a negative impact on Qatari budget causing a drop in the hydrocarbon production by 2.8%. This caused an increase in the fiscal deficit, estimated at 7.8 percent of GDP.
The agricultural area represents 6.5% of the total. Fishing, pearls and date palm cultivation had a significant role in Qatari budget until the oil discovery in 1939. Qatar is among the countries suffering food insufficiency, importing about $2.9 billion, that is about 90% of its local food demand. In 2000 the agricultural share of GDP is under 0.4% and decreases to 0.16% in 2015. The reason for this critical situation in Qatar as well as in all Gulf states is the problematic climatic conditions such as desertification, arable land deficiency, and water scarcity.
2.2. Saudi Arabia
Saudi Arabia is the largest producer of oil in the world, and the economy heavily depends on oil revenue. The oil revenue is estimated at 87%, and account for 45% of GDP and 80% of export earnings. After the oil crisis, Saudi Arabia registered a deficit of -13.6% of GDP in 2016. Poverty head count in Saudi Arabia reaches 35% while the unemployment rate is 11.2% in 2016, reaching 30% for young people, and increasing to 57.9% for young women. Total population is about 31.5 million.
The arable land is estimated at 1.63% and the agricultural land at about 80.78%. The food import dependency in 2013 reached nearly 80%, and import increased rapidly passing from $9.2 billion in 2000 to $39.6 billion in 2015. The agricultural production in Saudi Arabia is limited to Saharan cultures as date, fodder, barley, wheat, melons, and tomatoes cultivated in a very modest arable land area that cover around the 1.63% of the total country land. In additionally, the lack of investments in the agricultural sector led to a severe decline in the agricultural GDP that decreased from 5.2% in 2000 to 2.26% in 2015.
2.3. United Arab Emirates (UAE)
UAE is the fifth’s world producer of oil. Oil contributes to the 45% of national GDP, and UAE participates by 24% of Gulf area GDP, right after Saudi Arabia which accounts for 46%. In 2015, after the oil price crisis, the GDP decreased by 4.7% and the gross international reserve declined by 20.8% of GDP in 2016. Nevertheless, the UAE is considered the most diversified economy in the gulf area, while total population is close to 9.15 million.
The arable land reduced from 0.72% in 2000 to 0.45% in 2014, where the agricultural land is estimated about 4.57% of the total area. The agricultural GDP ranks less than 4% and declined from 2.3 % in 2000 to 0.7% in 2015. This makes UAE dependent upon food import, which amounts to about 90% of its food demand. The food import raised from $5.4 billion in 2000 to $28.5 billion in 2015.
2.4. Angola
Angola is one of the largest oil producers in sub-Saharan Africa, and an important member of OPEC countries. The country has many natural resources: oil, gas, diamonds, gold, water and agricultural land. The highest export revenue is in hydrocarbons. Oil production contributes about 75% of government revenue and more than 95% of export in the 2015. The recent decline of oil price caused a deficit of about 3.5% of GDP in 2015 and about 6.5% in 2016, with a repercussion on the inflation rate that increased from 7.3% in 2014 to 32.4% in 2016. 54.3% of Angolan people live with less than $1.25 per day (Barros, 2012). Unemployment raised at 26% since 2014, while the Angolan corruption perception index is among the highest in Africa (according to Transparency International data).
The agricultural potential of this country is quite significant, with approximately 47.5 million hectares of farmland. Notwithstanding, Angola exploits only 4 million hectares of its agricultural land. The agricultural share of GDP has lately increased to about 10% of the total GDP. Despite these efforts, Angola still suffers from massive malnutrition since it is exposed to severe climate shocks. This nation registers the highest world mortality rate for under 5-years-old children in a total population of around 25 million.
2.5. Nigeria
Nigeria is the most populated country (192 million in 2017) in Africa with one of the highest African GDP, the latter being heavily dependent on oil revenue. Oil in Nigeria represents 90 to 95% of Nigeria’s export revenue and contributes nearly 40% of GDP. Nowadays, Nigeria is one of the poorest 25 countries while in 1970 was one of the richest 50 countries. From 2015 to 2016 the annual inflation rate doubled reaching 18.6. The volatility of oil price caused a drastic decline of the economic balance.
Farmland counts about 85 million hectares but only 40% is cultivated (Onuka, 2017). In 2015 the agricultural share of GDP is estimated at 24.18% and about 70% of population works in the agricultural sector (Odeh, 2011). In 2016 Nigeria has spent around $20 billion of food import, particularly for wheat, sugar, rice, dairy products, frozen fish, and vegetables. The total food imports (% of merchandise imports) is estimated at 17.03% in 2014. Nigeria food market before the oil discovery was self-sufficient, but nowadays this is no longer the case. The country experiences the highest level of poverty and about 67% of the population is below the poverty line.
2.6. Algeria
Algeria exports gas and oil, and it is the 6th world’s liquefied natural gas (LNG) exporter. These resources provide 90 to 95% of export earnings, 60% of government budget. Immediately after the oil price shock in 2014, GDP declined by 27%. Inflation raised from 2.92% in 2014 to 6.4% in 2016, and deficit increased to 14% of GDP.
Algerian agriculture, before independence and oil discovery, covered 90% of domestic food demand. Subsequently, agricultural production began its decline and decreased to 30% in the 1980 (Tounsi, 1995). Urbanization and rural exodus (Bessaoud, 2006) increased the food demands to 75%. Recently the value of food import raised from $7.5 billion in 2012 to over $9.3 billion in 2015. This situation induced Algeria to collaborate with the neighborhood countries for a global Mediterranean food security initiative (Cheriet and Rastoin, 2010). The total population is around 39.7 million.
3. Models and methods
The goal of the paper is to assess the extent to which the oil and gas resources richness (oil-export) may contribute to the food dependency (food import) and to the food insecurity (undernourishment) in the selected six countries, characterized by common dynamics concerning food and oil sectors.
More formally, for each c-th country and for each t-year covered by the analysis, food import is expected to be affected by major demand driving forces such as population and gross national expenditure; by the national food supply, proxied by a crop index and by the percentage of the rural population; and finally, by the oil-export and by a corruption index that should represent the quality of the institutions: The higher the corruption index, the lower is the institutions quality. Inflation rate is also included in the model to take into account potential price variations impacts (equation 1).
ln Food importt,c = β0 + β1 ln oil exportt,c + β2 crop indext,c + β3 ln gross national expendituret,c + β4 %rural populationt,c + β5 corruption indext,c + β6 ln populationt,c + β7 inflationt,c + et,c (1)
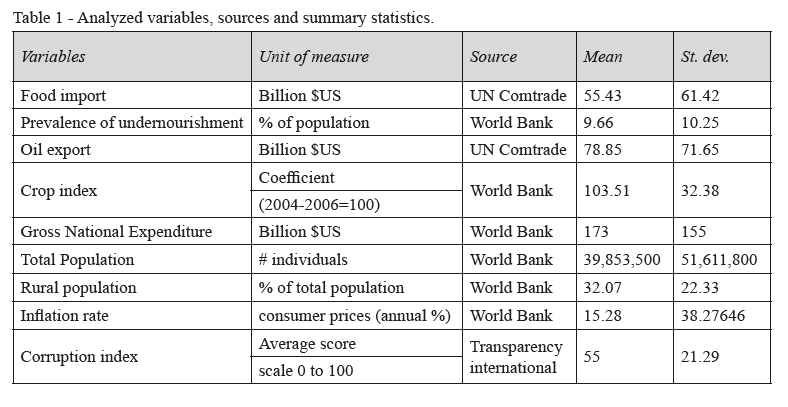
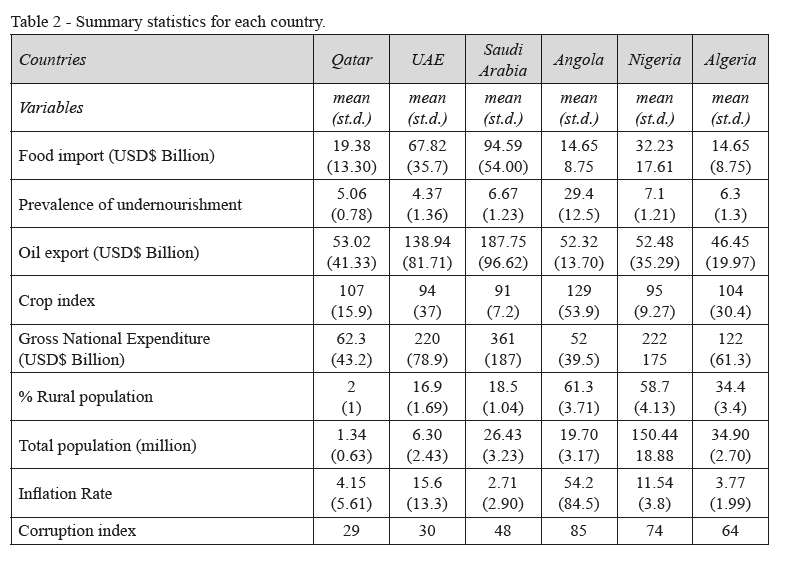
For each of the six selected countries a total of 16 years is covered, from year 2000 to 2015, and the overall sample size comprises 96 observations. Data sources and the summary statistics, sample means, and standard deviations of the variables are reported in Table 1, while Table 2 collects the summary statistics within each country.
Next, a second equation is estimated to explicitly investigate the “paradox of plenty”. Analytically this equation considers the prevalence of undernourishment in the targeted countries as function of the domestic provision of food: crop index and arable land; of the richness of the country taken into account by the gross national expenditure; by the corruption index, representing the quality of the national institutions (the higher the corruption index, the lower is the institutions quality), and by the oil export, our key variable for identifying the existence of the paradox of plenty. Moreover, in order to take into account, the overall access to food of the country that includes self-consumption, the share of the rural population is also considered as co-variate in the model.
The proposed equation is:
Undernourishmentt,c = α0 + α1 ln oil exportt,c + α2 ln populationt,c + α3 crop indext,c + α4 ln gross national expendituret,c + α5 %rural populationt,c + α6 corruption indext,c + α7 inflationt,c+ut,c (2)
An ordinary least squares (OLS) estimator has been applied to compute the βs and αs parameters of equation (1) and equation (2). Besides the OLS regression, the quantile regression estimator, QR, is here implemented at different quantiles. QR provides a deeper characterization of the conditional distribution of the dependent variable, requires weaker assumptions than OLS and is more robust to outliers. Koenker and Bassett (1978) present the quantile regression estimator as the solution to the following objective function
![]()
where q is the chosen quantile, yt,c is the dependent variable, Food import for equation 1 and Undernourishment for equation 2, xt,c, is the row vector of explanatory variables while γ is the k column-vector of regression coefficients, in turn β in equation (1) and α in equation (2). At the median, where q = 0.5, the objective function simplifies into 0.5 ![]() , which yields the absolute loss function, i.e. the median regression estimator or the least absolute deviations estimator. Away from the median the above objective function is asymmetric, assigning weights q =.75 for y < xγ and (1-q) =.25 for y ≥ xγ, to compute the regression at the lower quartile, that is moving the estimated regression line toward the left tail of the conditional distribution of the dependent variable y. At the upper quartile the asymmetric weights become q =.25 for y < xγ, and (1-q) =.75 for y ≥ xγ, thus attracting the estimated line toward the right tail of the conditional distribution of y and yielding the regression estimated at the upper quartile.
, which yields the absolute loss function, i.e. the median regression estimator or the least absolute deviations estimator. Away from the median the above objective function is asymmetric, assigning weights q =.75 for y < xγ and (1-q) =.25 for y ≥ xγ, to compute the regression at the lower quartile, that is moving the estimated regression line toward the left tail of the conditional distribution of the dependent variable y. At the upper quartile the asymmetric weights become q =.25 for y < xγ, and (1-q) =.75 for y ≥ xγ, thus attracting the estimated line toward the right tail of the conditional distribution of y and yielding the regression estimated at the upper quartile.
4. Results
4.1. The impact of oil export on food import
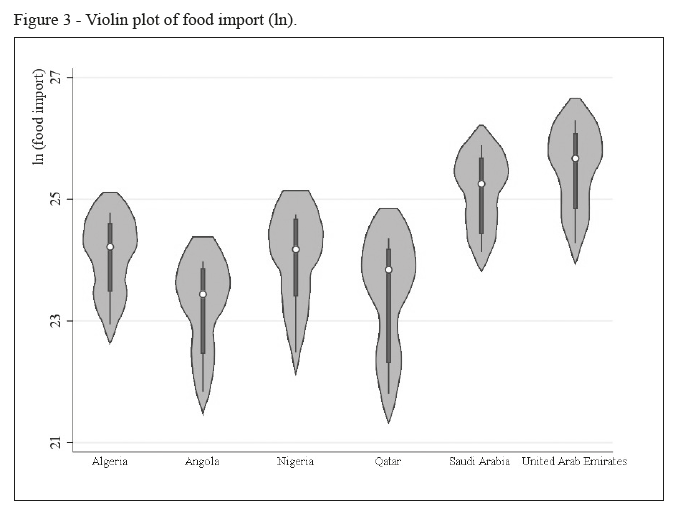
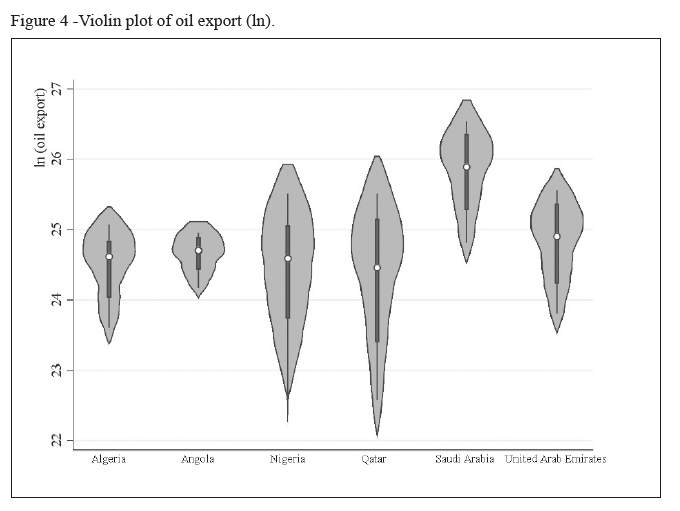
Figure 3 and 4 show the distribution of the key variables of interest (food import and oil export) across the analyzed countries. Apart from Angola, all the countries here considered show wide fluctuations of both oil export and food import values over time. More in detail, Qatar has the greatest variability in both oil export and food import over time. To the contrary, Angola presents the smallest dispersion in the key variables, even if Angola shows one of the smallest food import value.
Starting with the food import equation (1), the Dickey Fuller test for unit root in the model with a constant term assumes the value of DF = -1.91 and fails to reject the null when compared to the 5% critical value of -2.86. Therefore, an error correction model is implemented where the first difference of the dependent variable, food import, is explained by its own lagged values, the lagged values of all the explanatory variables together with their first differences. Equation (1) becomes
ΔlnFood importt,c = f(ln Food importt-1,c; ln oil exportt-1,c; crop indext-1,c; ln populationt-1,c; ln gross national expendituret-1,c; corruption indext-1,c; inflationt-1,c, %rural popt-1,c, Δoil exportt,c; Δcrop indext,c; Δln populationt,c; Δln gross national expendituret,c; Δcorruption indext,c , Δinflationt,c, Δ%rural popt,c) (4)
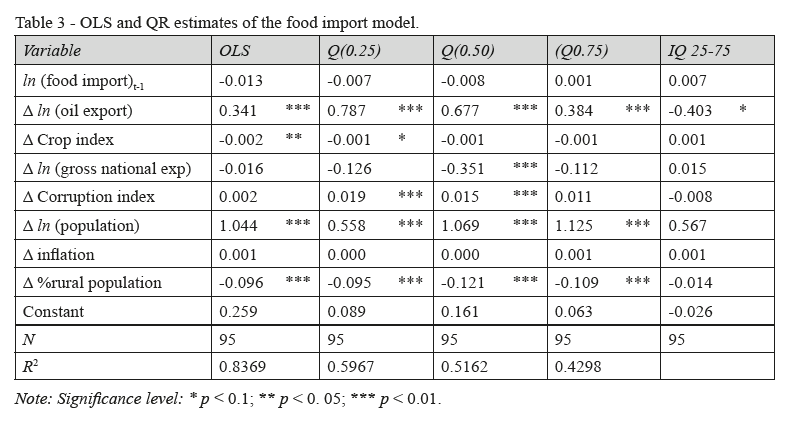
However, all the lagged explanatory variables turn out to be statistically insignificant and are not reported in the table1. In the first column of Table 3 the ordinary least squares (OLS) estimates are collected2. The results mainly confirm the expected relations: oil export and domestic demand (proxied by population) have a statistically significant and directly proportional impact on food import. The national food supply, proxied by the crop index, negatively influences the food import. In the same way, the higher the percentage of population living in rural area, the lower the level of food imports. As concerns the role of the quality of the institutions, measured through the corruption index, it does not seem to influence the food import.
The above-mentioned results indicate the nature and the magnitude of the relation at the conditional mean of the food import. QR estimator could be used to move the analysis away from the mean, at higher and lower quartile of the food import. Columns 2 to 4 in Table 3 report the quantile regression estimates at the first quartile, at the second, that is at the median regression, and at the third quartile.
QR results considerably differ from their OLS analogues. Oil export has a very large impact on food import at the first quartile, showing that it has a wider impact at the lower levels of food import. The crop index is negative as in the OLS case but it is statistically significant only in the first quartile, implying that the local food production reduces food import mainly at the lower level of import. The impact of domestic demand, instead, increases with the quartiles since the greater is the population the greater is food import, while the corruption index increases food import mainly at lower level of food import, at the 25th percentile.
4.2. The paradox of plenty “assessment”
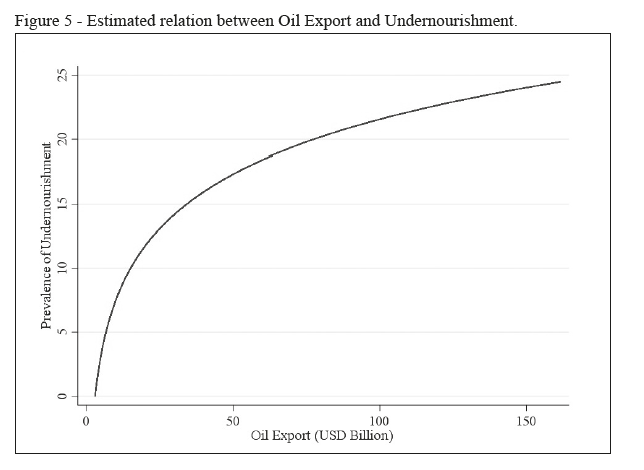
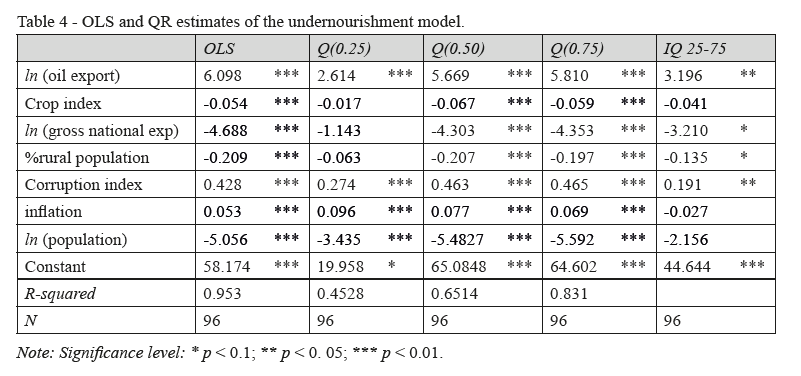
Next, we move to the paradox of plenty and Table 4 reports the estimated coefficients. For the undernourishment variable the Dickey Fuller test assumes the value of DF= – 8.7, and the null of unit root can be safely rejected. The OLS analysis yields statistically significant estimates of most regression coefficients. The positive coefficient of Oil export well represents the “paradox”. Ceteris-paribus and by accounting for the “richness” of the country through the variable measuring the gross national expenditure, the increase of oil export does not reduce undernourishment. In Figure 5 is plotted the estimated relation between oil export and undernourishment.
Moreover, the positive coefficient of the corruption index tells us that the quality of national institutions is a limiting factor to adverse undernourishment. As concerns all the other variables included in the model, their coefficients are in line with what one would expect. The higher the crop index, the lower the level of undernourishment, and the gross national expenditure reduces significantly undernourishment as well. Moreover, the increase of rural population significantly reduces the level of the undernourishment, while the higher the inflation rate, the higher the level of undernourishment.
Moving to the quantile regressions analysis, away from the mean level of undernourishment the QR results differ from the OLS estimates: the oil export impact increases with the quartiles to grow above the OLS estimate at the upper quartile. This indicates that the paradox increases with the increase of the level of undernourishment; national expenditure and rural population show a greater significant negative impact at the upper quartiles, i.e., their increase reduces the undernourishment level, and particularly so when the level of undernourishment is high. In particular, corruption contributes to increase hunger, particularly at the high quartiles of undernourishment. So, to conclude, the estimated coefficients on corruption and oil export confirm the existence of “the paradox of plenty” for the six countries analyzed.
5. Discussion and Conclusion
Agriculture represents a key sector in developing countries. It provides valuable investment in human capital as well as stability of agricultural prices in the light of an increasing food demand caused by the demographic growth. Food security is not an end exclusively for the agricultural sector, but it complements the growth of the whole economy. If a country is characterized by a prosperous agriculture that contributes to the improvement of food security, it will also develop other strategic sectors like, for instance, food industry or services guaranteeing farmers funding. In the opposite, if a country is not food self-sufficient, its security depends on the capacity to import food that, in turn, that may be affected by the export revenues (i.e. oil) and by their volatility. Moreover, oil-rich countries generally pay little attention to non-oil sectors such as the agricultural one. The relations illustrated above provided the background of this study aimed to test the extent to which, in six countries within the Africa and Middle East areas, the oil and gas resources richness (oil-export) contribute to the food dependency in terms of food import and to the food insecurity (undernourishment), providing empirical evidence of the presence of the “paradox of plenty”.
The existence of food dependence on oil revenue is not an exclusive condition of the six analyzed countries. However, these countries are also characterized by socio-economic instability and food insecurity, all struggling in using natural resources to enhance agricultural production. Import of food products, which is increasingly expensive in relative terms, has lately led governments to introduce strategies to increase the percentage of food self-sufficiency. For instance, food insecurity in the developing countries within the African continent may increase the migration to Mediterranean region (Lacirignola et al., 2015; Fawole and Ozkan, 2018).
Our study aimed to contribute to an increasing strand of literature, that provides statistical evidence of the existence of the paradox: indeed, first empirical studies on the resource curse theory date back to the Sachs and Warner (1995) that identified a negative relationship between economic development and richness of natural resources. Subsequently, Gylfason (2001, 2006) showed to what extent public education expenditures and agricultural productivity was negatively correlated with resources dependency. Overall several other works were carried out such as the one of Mehrara (2009) that highlights the presence of a non-linear relationship between oil revenues and economic development. Recently, via heterogeneous panel cointegration techniques, Kim and Lin (2017) have provided a re-examination of the resource curse in developing countries. Likewise, a survey has been examined by Van der Ploeg and Poelhekke (2016) for comprehensive econometric analysis of local economies, and within-country quantitative impact of natural resources windfalls. Our study analyzed explicitly the paradox in terms of food dependency and food security. The empirical approach allowed to deepen the analysis of food import dependence and undernourishment in the selected countries, showing the sizable and statistically significant impact of oil export on these variables.
This study has several limitations. Although the selected countries cover Africa and middle East, our analyses do not consider other important countries of the region, currently involved in conflicts such as Iraq, Syria and Libya but more importantly other areas of the world such as south America that indeed share similar conditions. Thus, our results cannot be generalized to other countries, as well as we cannot implicitly assumes that neighbor countries face different conditions from those observed in our sample. Moreover, the sampling is restricted to only 16 years due to the limited availability of the data. This situation has also led to a relatively low dimension of the sample size that also limited the possibility to include more covariates for controlling other confounding effects.
Even if our study evidenced the paradox of plenty in terms of food security, almost all the countries analyzed have recently implemented different actions in support of the agricultural sector aiming to ensure food self-sufficiency by promoting a sustainable modernization of the agricultural sector, attempting to better exploit available resources such as uncultivated land and groundwater. While it remains to be seen if these actions will lead to a reduction of food dependency, the introduction of efficient systems of financing and of crop insurance, through the strengthening and revitalization of banks and agricultural agencies, is still needed. The latter would ensure credit for rural areas and would promote agriculture and economic stability.
References
- Auty R.M., 1993. Sustaining Development in Mineral Economies: The Resource Curse Thesis. London: Routledge, 288 pages.
- Barros C.P., 2012. The resource curse and rent-seeking in Angola. CEsA Working paper no. 102. Lisbona: Instituto Superior de Economia e Gestão.
- Bessaoud O., 2006. La stratégie de développement rural en Algérie. Options Méditerranéennes CIHEAM, 71: 79-89.
- Caracciolo F., Cembalo L., Lombardi A. and Thompson G., 2014. Distributional Effects of Maize Price Increases in Malawi. The Journal of Development Studies, 50(2): 258-275.
- Cheriet F., Rastoin J.L., 2010. Enjeux des coopérations inter-entreprises pour la sécurité alimentaire en Méditerranée. New Medit Journal, 9(3): 4-12.
- Collier P., Hoeffler A., 2004. Greed and grievance in civil war. Oxford Economic Papers, 56(4): 563-595.
- Corden W.M., Neary J.P., 1982. Booming sector and de-industrialisation in a small open economy. The Economic Journal, 368(92): 825-848.
- Fawole W.O., Ozkan B., 2018. Food insecurity risks perception and management strategies among households: Implications for zero hunger target in Nigeria. New Medit Journal, 17(2): 29-42.
- Gardan P.S., 2013. La stratégie économique du Qatar: Politique énergétique et diversification économique. Confluences Méditerranée, 84(1): 45-57.
- Gary I., Karl T.L., 2003. Bottom of the barrel: Africa’s Oil Boom and the Poor. Catholic Relief Services, Maryland, 110 pages.
- Gylfason T., 2001. Natural resources, education, and economic development. European Economic Review, 45(4): 847-859.
- Gylfason T., 2006. Natural resources and economic growth: from dependence to diversification (pp. 201-231). In: Broadman H., Paas T., Welfens P. (eds.), Economic Liberalization and Integration Policy. Berlin-Heidelberg: Springer.
- Karl T.L., 1997. The Paradox of Plenty. Oil Booms and Petro-States. Berkeley: University of California Press, 342 pages.
- Karl T.L., 2007. Oil-led development: social, political, and economic consequences. Encyclopedia of Energy, 4: 661-672.
- Kim D.H., Lin S.C., 2017. Natural resources and economic development: New panel evidence. Environmental and Resource Economics, 66(2): 363-391.
- Koenker R., Bassett G., 1978. Regression Quantiles, Econometrica, 46(1): 33-50.
- Lacirignola C., Adinolfi F., Capitanio F., 2015. Food security in the Mediterranean countries. New Medit Journal, 14(4): 2-10.
- Lam R., Wantchekon L., 2003. Political Dutch Disease (Working Paper). Evanston: Northwestern University.
- Mehrara M., 2009. Reconsidering the resource curse in oil-exporting countries. Energy Policy, 37(3): 1165-1169.
- Mikesell R.F., 1997. Explaining the resource curse, with special reference to mineral-exporting countries. Resources Policy, 23(4): 191-199.
- Odeh L.E., 2011. Sino-Nigerian Economic Relations under the Obasanjo Administration. Ilorin Journal of History and International Studies, 2(1): 217-231.
- Okpanachi E., 2011. Confronting the Governance Challenges of Developing Nigeria’s Extractive Industry: Policy and Performance in the Oil and Gas Sector. Review of Policy Research, 28(1): 25-47.
- Onuka O.I., 2017. Nigeria’s Food Import Dependency – Agricultural Transformation. Agricultural Development, 2(1): 1-12.
- Sachs J., Warner A.M., 1995. Natural Resources Abundance and economic growth. Cambridge: National bureau for Economic Research. NBER, (Working Paper 5398).
- Sachs J.D., Warner A.M., 2001. The curse of natural resources. European Economic Review, 45(4): 827-838.
- Sala-i-Martin X., Subramanian A., 2013. Addressing the Natural Resource Curse: An Illustration from Nigeria. Journal of African Economies, 22(4): 570-615.
- Tornell A., Lane P.R., 1999. The voracity effect. American economic review, 89(1): 22-46.
- Tounsi M., 1995. Industrialisation et sécurité alimentaire en Algérie. La sécurité alimentaire en méditerranée. Options Méditerranéennes CIHEAM, 26: 61-69.
- Tsui K.K., 2011. More Oil, Less Democracy: Evidence from Worldwide Crude Oil Discoveries. Economic Journal, 121(551): 89-115.
- Van der Ploeg F., Poelhekke S., 2016. The impact of natural resources: Survey of recent quantitative evidence. The Journal of Development Studies, 53(2): 205-216.
1 The Engel and Granger residual based test of cointegration is reported at the bottom of the table. By regressing the first difference of the residuals from the cointegrated equation on the lagged residuals, the stationarity of the residuals of the cointegrated model is checked. The test function is the analogous of the Dickey Fuller test but with different critical values. The estimated value of -21.10 allows to reject the null of non-cointegration with respect to the 1% critical value of -5.25.
2 The results are computed using Stata version 15.