Abstract
Apple production sector in Albania is growing very fast in Albania but research about apple production efficiency is almost absent. This research aims at assessing the technical efficiency and factors affecting it for the Albanian apple farms. Data of 150 randomly selected farmers in the area of Korça region are analyzed with the Stochastic Frontier Approach. The average level of technical efficiency results 88%, with 12% potential for improvement. The efficiency gap is about 21%. Major factors with positive effect on technical efficiency result the access to advisory services, average plots size, number of apple plots; education and proportion of orchards under modern technology have negative effects; age, and farmer’s experience are not significant. Measures to support planting of apples should take into account the size of plots. There is much space to improve extension services to farmers, so adequate policies are needed to support farmers with training, information to improve their skills and knowledge, to ensure they are supplied with quality inputs and technologies at reasonable prices, and policies to improve farmers access to markets.
DOI: 10.30682/nm1902d
Myslym Osmani*, Arben Kambo*
* Agricultural University of Tirana, Department of Economics and Rural Development Policies.
Corresponding author: mosmani@ubt.edu.al
Cite this Item: Osmani M., Kambo A., 2019. Efficiency of apple small-scale farming in Albania-a Stochastic Frontier Approach, New Medit, 18 (2): pp. 71-88, http://dx.doi.org/10.30682/nm1902d
1. Introduction
1.1. Agriculture and apple production in Albania
Agriculture is an important economic sector of Albania, with a contribution of roughly 17% to its GDP. Albania’s farm sector is characterized by a large number of farms, about 350000, most of which are small and very small; the average size of the Albanian farms is about 13 dunums. Though small, Albanian farms are composed of a relatively big number of plots or parcels, about 4 plots on the average. This is the result of the land law that Albania adopted and implemented immediately after the fall of the communism at the beginning of nineties of the last century. This fragmentized agriculture land is considered actually the major structural obstacle to a faster and more efficient development of the agricultural sector.
Korça region is situated in East-Southern Albania and it is a very important agriculture area. It occupies about 11% of its agricultural land and about 12% of Albanian farms operate in this region. But its contribution to the country’s apple production is essential, with 60-70% of national apple production. And statistics qualify apple as the major type of fruit in Korça. In year 2016 it occupied 69% of the region total area planted with fruit, and 83% of the fruit production. Korea farms as well are small and very fragmented, with an average size of 14 dumdums. Apple production trends in Korea have been powerful, as a result of new plantations and growth of productivity. Thus, in year 2016 in comparison with year 1995 the volume of apple production increased by about 15 times and yields by 3 times.
1.2. Research problem, goal and objectives
In a context of a fast-growing apple producing subsector, the need to know the level of its efficiency, that is efficiency of farm land and other farm resources devoted to its production, including state support has become critical. Alongside with this, it is also important the need to know farm-to-farm differences in the level of efficiency of resources used, to make aware policymakers of the need for policy measures, local and national initiatives and programs to improve use of resources in the future. All these constitute the research problem of this study.
The purpose of this study is to assess the level technical efficiency of the apple production in Albania, specifically Korça area. Specific research objectives are:
- Evaluate an aggregate level of technical efficiency of the small-scale apple production sector in the study area.
- Identify major factors or determinants that actually govern the level of apple efficiency or inefficiency.
- Based on research findings, indicate initiatives and policy measures to enhance the efficiency level in apple.
1.3. Literature review
Conceptual framework
Efficiency is a key economic concept. Economic efficiency is the ability of a firm to produce and distribute its product at lowest possible cost (Issacs and Martin, 1993). Otherwise, a farm is economically efficient if it is able to produce an amount of output at minimum cost for a given level of technology (Farrell, 1957). A precondition for the economic efficiency is the technical and the allocative efficiency.
Technical efficiency is the ability of a firm (farm) to produce maximum output from a given set of inputs, or to produce a given amount of output with minimum inputs.
Allocative efficiency is the ability of the firm to produce at minimum cost, or use inputs in optimal proportions for given input prices and technology. Graph 1 below illustrates technical and allocative efficiency.
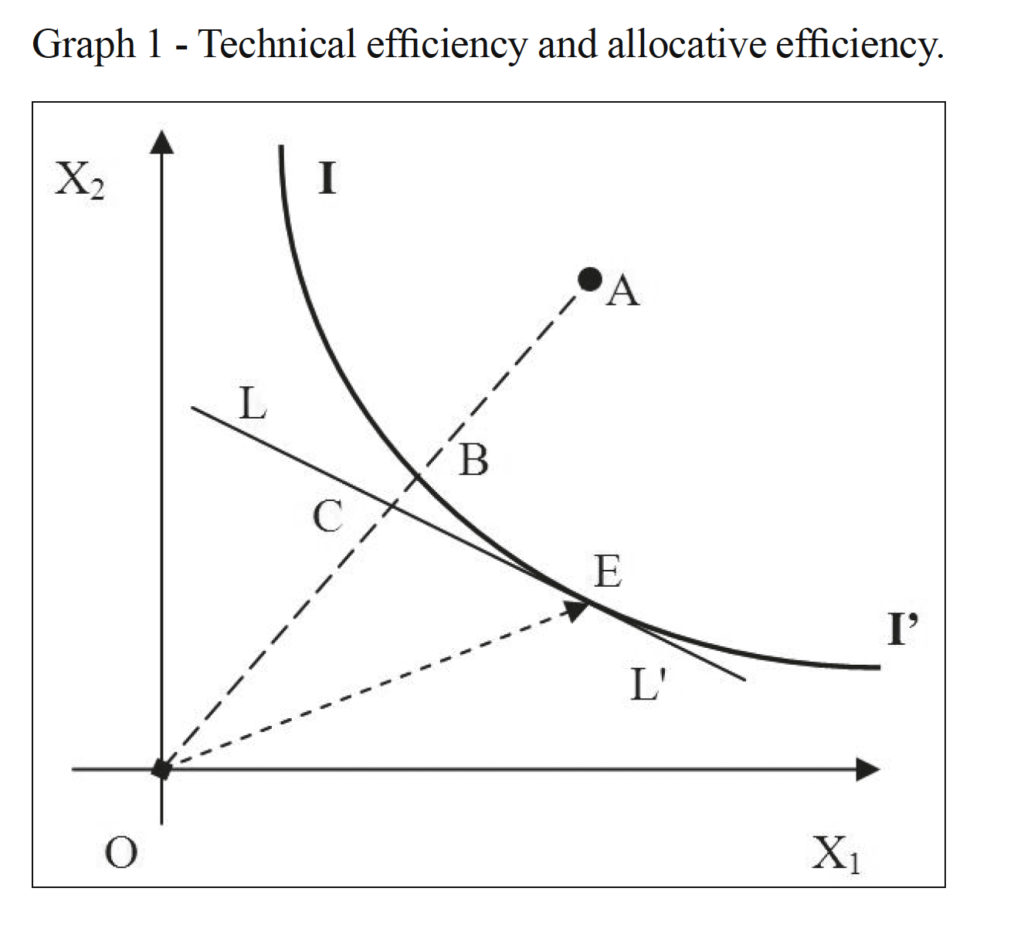
In this research we deal with technical efficiency of apple production. A firm is using two inputs X1 and X2 to produce a type of product. II’ is the isoquant curve, representing all points with the same amount of output obtained by using minimum inputs. For different points on the curve we same output but different combination of inputs X1 and X2. So if firm is on II’ it is efficient. If it uses inputs in amounts as determined by point A it will be inefficient. Graphically inefficiency is the segment AB. In relative terms, inefficiency is the ratio AB/OA. This ratio is less than one. Inefficiency is the proportion by which inputs could be reduced without loss in output. Technical efficiency is the ratio OB/OA. Allocative efficiency is achieved at point E, because it is the touch point of isoquant and the budget line L. At this point the proportion of inputs is optimal and the same amount of output is produced at minimum cost. AE is the ratio OC/OB. Economic efficiency would be the production of TE and AE. At point E both TE and AE and economic efficiency equal to one.
If we denote by Ymax the maximum amount of production that can be produced with a given set of inputs, and by Y we denote the factual volume of production, then the technical efficiency could be calculated:
![]()
While the technical inefficiency (TI) is the opposite of the technical efficiency and could be calculated|:

More theoretical information about technical efficiency can be found in (Debertin, 2012); (Khan and Saeed, 2011); (Osmani and Andoni, 2017).
Empirical research
Empirical research about technical efficiency is abundant. Most of it is focused on the assessment of the level of technical efficiency, as well on the identification and assessment of factors determining it for specific farm products, or the whole farm production in general. All these factors could be economic, socio-demographic, technological, and environmental including weather factors. Apart from theoretical wisdom and expectations, for different products, and development context of countries, even for the same product and country, empirical findings do not always converge.
Coelli and Battese studied inefficiency factors for Indian farms and found that age, education and farm size were important factors for technical efficiency. They used one-stage SFA (Stochastic Frontier Approach) technique, that is they put in one model the production inputs and potential inefficiency determinants or factors (Coelli and Battese, 1996). Other authors also argue that efficiency change in farming is driven by education, extension, the ratio of family-to-total labor, the farm size, as well as weather variables (Darlington and Shumway, 2015). Other researchers studied the effect of a combined public-private extension service on efficiency (Dinar et al., 2007). They used a non-neutral Stochastic Frontier Approach in the Cretan agriculture and found that combining both types of extension service, private and public, is more efficient as compared to no extension or only one type of extension.
Some authors used time-varying and time-invariant inefficiency models of production (Simwaka et al., 2013). In a study for farm efficiency in South Africa the results they obtained show that fertilizer, labor, seeds, and farmers’ age contribute to technical efficiency. In an efficiency study for Turkish agriculture using the SFA method based on information gathered for a sample of farm managers is found that education, experience, credit use, participation by women and information negatively affected technical inefficiency; while age, family size, off-farm income and farm size had a positive relationship with inefficiency (Bozoğlu and Ceyhan, 2007).
Some Indian researchers surveyed 461 farmers from the district of Pulwama of Jammu & Kashmir (India) and showed that occupation, farm experience, household size, farm size, and seed type were found to be important factors of farm technical efficiency (Bhatt and Bhatt, 2014). An analysis of raspberry production in Chile showed that age, experience and training had a significant but negative effect on efficiency. Education and extension didn’t have any effect (Jara-Rojas et al., 2016).
Specifically for fruit production, a study on technical efficiency of fruit production in carried out for Afghanistan (Mohsen, 2017). For the production function he found that land water, fertilizers, manure, number of trees, pesticides and other inputs. Only land and trees result significant. For the technical efficiency he found that age, household number, and education were not significant, while the expertise was significant but with negative effect on efficiency.
SFA method has been used also to evaluate technical efficiency of grape production (Moreira et al., 2011). The authors take into consideration factors such as the farm size, number of blocks and size of blocks, fertilizers, labor cost, machinery cost, age of plantation, type of grape and location of the farm in the country. Labor cost, age of plantation, size of blocks resulted positively significant, while inputs had no effect, type of grape and machinery cost also had a significant and positive effect.
In a research for the assessment of technical efficiency in fruits and vegetables (Rajendran, 2014), using SFA method found that farm size, education and access to credit, road facilities, labor cost, share of irrigated area and use of fertilizers contribute positively to efficiency. In relation with apple production in Pakistan, (Murtaza and Thapa, 2017), found that farmers’ experience and access to training and extension services affect positively and significantly the apple farmers’ technical efficiency.
SFA method is used also to investigate the technical efficiency in olive growing farm sector in Spain (Lambarraa et al., 2007). The authors take into consideration land, labor, amount of fertilizers and pesticides, irrigation, age of farmers, price of pesticides and fertilizers, age of olive orchards and their location, composition of work force in terms of farm and hired work, etc. They found that age of managers, location of farms and workforce composition affected significantly the level of technical efficiency.
Another interesting study has been made for the case of olive growing in Greece (Crete) using panel data (Tzouvelekas et al., 1997). It revealed that olive farm efficiency is affected by farm size, the farmer’s education, the existence of an improvement plan, and land fragmentation. Again for olive production, the technical efficiency has been studied in case of Tunisia (Kashiwagi et al., 2012). The authors found that number of tractors, number of farm plus hired working days, cost of inputs, number of trees had significant effects on the volume of production. Regarding technical efficiency model, he found that the share of irrigated trees, education and technology levels, olive area, and the cultivars had positive effects, whereas labor had a negative effect on production.
The efficiency of the small banana growers in Kushtia district of Bangladesh is studied using a translog model (Hossain et al., 2015). The authors found that size of land used, fertilizers amount and cost of labor as factors in the production function and found that age and education level of the farmers had a positive effect on technical efficiency, while experience had negative effect.
The efficiency is studied also for non-fruit sector and efficiency factors are similar. As an example, in case of tomatoes growing in Pakistan it is found that public education and again extension services are determinants of efficiency of tomatoes growing (Khan and Saeed, 2011).
1.5. Research hypotheses
Review of literature revealed a number of variables as potential factors to be used to assess technical efficiency in apple production. Based on the research goal and objectives, findings from literature review, and the specific development context of agriculture in Albania, we formulated the following research hypotheses:
1. Farms having larger number of plots, with larger average plots size and larger proportion of apple farm size under modern technology, are expected to have higher production technical efficiency, ceteris paribus. Otherwise, a positive effect of these factors on efficiency is expected.
2. Farmers having more years of formal education, who are older and have more years of experience in farming are expected to have higher level of production technical efficiency, ceteris paribus. Otherwise, a positive effect of these factors on efficiency is expected.
3. Farmers having better access to quality farm advisory services are expected to have higher level of technical efficiency. ceteris paribus. Otherwise, a positive effect of these factors on efficiency is expected.
2. Data and methods
2.1. Data
In Albania there doesn’t exist any system of farm data records, such as FADN data system that exists in EU countries. Thus, to collect data we used a special survey. An accidental sampling of 150 apple producer farmers in Korça district was carried out and a questionnaire was completed for each farmer (excluding those who refused to be interviewed or missing at the time of interviewing) through face-to-face interviewing.
A key point in using SFA method for production efficiency assessment is the determination of factors to be included in the production model. In this context, all potential production factors can be divided into two categories: production inputs and efficiency factors. Based on theoretical wisdom and empirical evidence (Kambo et al., 2018), major inputs for apple production are farmland size planted with apple, use of fertilizers, insecticides and pesticides, and water for irrigation. In our research we use amount of complex fertilizers as a representative variable for use of fertilizers as practice has shown that farmers use commonly this type of fertilizer; times of spraying as a proxy variable for the amount of pesticides and insecticides used; times of irrigations as a proxy for the amount of water used. In relation with the second category of variables, we collected data on farmers’ age and education, farming experience in years; to represent the level of technology used we used as a proxy the proportion of the apple area under modern technology; number of plots planted with apple and average size of plots are also potential efficiency variables. As empirical research shows, access to and quality of advisory services used by farmers is also important for the production efficiency. To take account of this we gathered data on access and quality of the advisory services (extension) as perceived by farmers. Table 1 below presents the variables taken into consideration as potential factors of apple production and efficiency.
|
Table 1 – Variables and their measurement scale. |
|||||
|
Variables |
Measurement scale |
Measurement unit |
Variables |
Measurement scale |
Measurement unit |
|
Production |
Ratio |
Ton |
Proportion of area under modern technology |
Ratio |
% |
|
Fertilizers |
Ratio |
Kilograms of fertilizers used |
Number of farm plots |
Ratio |
Number of plots |
|
Apple area |
Ratio |
Planted area in dunums |
Experience |
Ratio |
Number of years |
|
Irrigations |
Ratio |
Times of irrigation |
Extension quality |
Nominal |
Low, Average, High |
|
Spraying |
Ratio |
Times of spraying |
Average plots size |
Ratio |
Dunums |
|
Education |
Nominal |
Low, Medium, High |
|||
|
Age |
Ratio |
Years |
2.2. Method
In our research we used SFA (Stochastic Frontier Approach) method. The key point in SFA is that the residual term in a production econometric model is not just a stochastic error term, but it is composed of two components, inefficiency component, and the error component. So, its basic assumption is that all firms are not equally efficient, that’s why even if they may use the same amounts of resources their output may be not the same. Based on this, the econometric model according to SFA would be:
Y = f(X, B)+v–u
Here X is a vector of independent variables, factors or inputs. B is a set of parameters to be estimated. Unlike the standard regression model SFA assumes that here the error term e is composed of two parts, of an error part (v) and inefficiency part (u):
v–u=e
Here the component u is ≥0), while f(X, B)+e is called Stochastic Frontier, (SF). Using simple algebra, we get u=Y-SF, thus inefficiency means less production for given inputs, so production for each individual farm is under the frontier. To calculate efficiency or inefficiency score for each farm, first we have to calculate inefficiency term u. This could be indirectly calculated supposing different shapes of distributions for u. One of usually used forms is that of half-normal distribution (exponential shape is another). Under this assumption:
![]() The conditional distribution of u given e is u~N (μ*,σ*), truncated at zero. Inefficiency term u (its expected value could be calculated using the so-called the Jondrow formula:
The conditional distribution of u given e is u~N (μ*,σ*), truncated at zero. Inefficiency term u (its expected value could be calculated using the so-called the Jondrow formula:

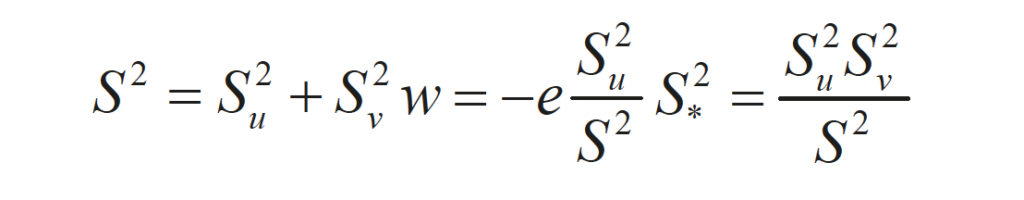
Where:

Here φ is the density and ϕ is the cumulative distribution function for standard normal distribution. Su and Sv are the standard deviations for the term u and v, respectively. Then, technical production efficiency TE for each farm would be:
TEi=exp(-ui)
Technical efficiency TE for the each cross-section (farm) could be calculated alternatively directly by the formula:
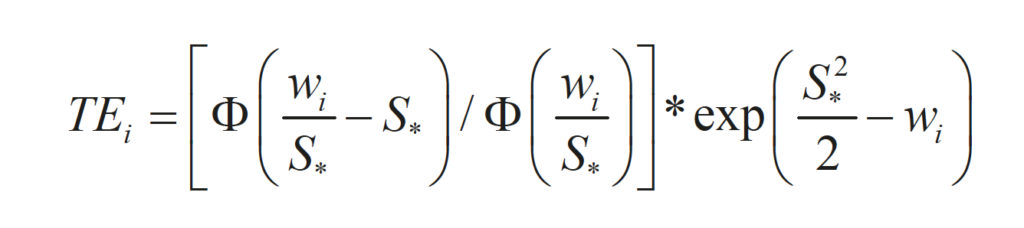
Where:
Technical efficiency for the sample is:
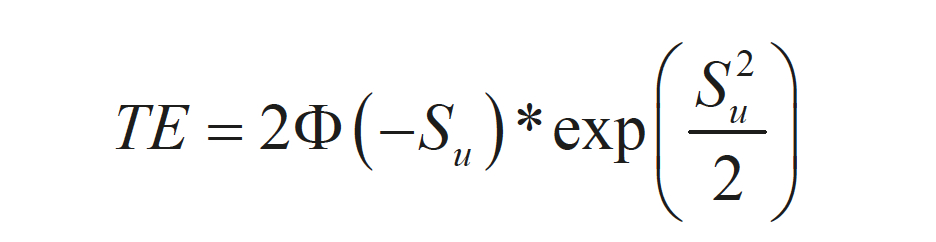
Here Φ is the cumulative standard normal distribution function.
One important aspect of the SFA is the stochastic frontier f(X, B). In the case of production technical efficiency this model is a production function. This function or a model that can take different forms. Two of most used forms are the conventional Cobb-Douglas and the translog models. The conventional model with k factors X has the following form:
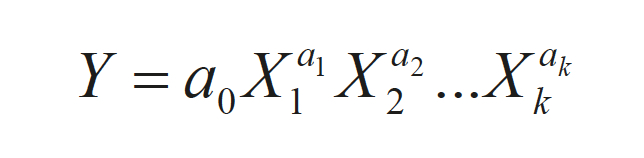
Usually the logarithmic form of the above model is used:
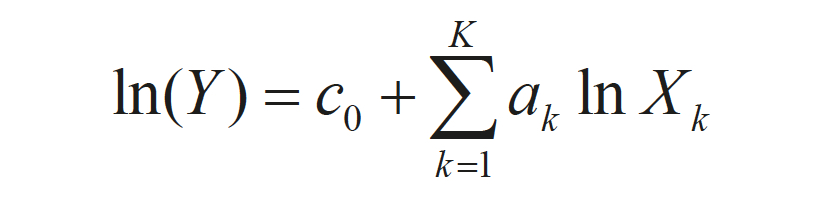
The translog model includes as independent variables also the square of each factor and combinations (arithmetic production) of any pair of factors. It has the form:
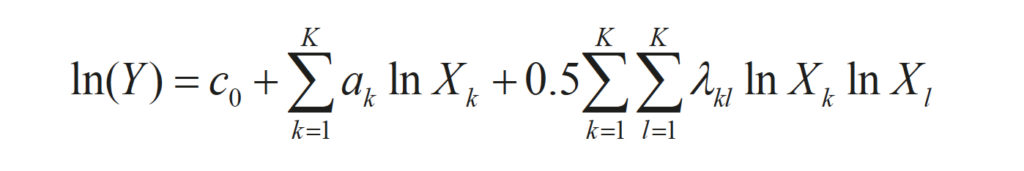
The conventional model is easier to estimate and interpret. Also fewer parameters are estimated (k+3). But it assumes that all farms have the same production elasticity for a given input (ai) and they have constant (equal to 1) substitution elasticities. Sum of the coefficients gives the so-called scale elasticity. On the other hand, the translog model is a generalization of the conventional model and it is a more flexible form of the production function. This form allows to calculate farm-specific production and scale elasticities.
There are two approaches in assessing technical efficiency scores and its determinants, using any of the two models. One approach is to first estimate the production model (conventional or translog as above). Then based on the estimated models the technical efficiency scores are calculated and then a model of TE against its potential factors (with M efficiency factors Z) is estimated:
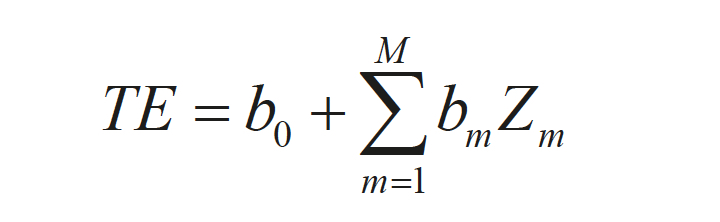
The first model helps to calculate the TE scores and the last one helps to assess the efficiency factors. One major critic to this approach is that by not including the efficiency factors in the same model with production inputs, the estimated coefficients of the production model are biased.
Another approach is to include in the same model both production inputs and efficiency factors, estimating so only one model.
This model helps to calculate TE scores and at the same time to assess efficiency factors. This way of model building is assumed to yield unbiased model parameters (Coelli et al., 2005). Because of this, the one-stage estimation is preferred. However, in our research we use both conventional and translog models and analyse them to propose the most adequate model for our research case.
To perform model estimation, we used GRETL econometric package, (See GRETL User Guide, 2012). More technical and theoretical information about TE and models of TE the reader can find in Jondrow et al., 1982; Aigner et al., 1977; Coelli and Battese, 1996; Coelli, 1995; Coelli et al., 2005; Gujarati, 2003; Osmani, 2017.
3. Results
At the beginning we present some summary statistics for the ratio scale variables only as in Table 2.
As Table 2 indicates, the average farm size is small of 12.87 dunums; the apple farm in Korça is composed of 3-4 plots with an average of 4.3 dunums per plot. But we can easily identify a large variance of the apple land per farm (up to maximum 45 dunums), number of plots (up to 9) and size of plot (up to 10 dunums). Also, we can see that some farmers are very old (up to 70 years old) and some farms do not use at all fertilizers. Some farms do a lot of spraying (up to 24 times). The variable with the largest variance seem to be the share of modern-type orchard (up to 100%).
|
Table 2 – Summary Statistics for selected variables. |
||||||||
|
Variable |
Mean |
Median |
Minimum |
Maximum |
Std. Dev. |
Cv |
Skewness |
IQ range |
|
Production |
43.39 |
40.00 |
8.42 |
132.65 |
24.00 |
0,5531 |
1,0798 |
27.74 |
|
Experience |
11.40 |
10.00 |
2.000 |
20.00 |
4.246 |
0.3724 |
0.2857 |
6.500 |
|
Apple area |
12.87 |
11.00 |
3.000 |
45.00 |
7.059 |
0.5484 |
1.7539 |
8.000 |
|
Age |
47.73 |
48.00 |
25.00 |
70.00 |
10.95 |
0.2294 |
-0.1318 |
18.00 |
|
Plots |
3.479 |
3.000 |
1.000 |
9.000 |
1.828 |
0.5256 |
0.4698 |
3.000 |
|
Fertilizers |
950.6 |
900.0 |
0.000 |
2800. |
554.1 |
0.5829 |
0.3985 |
10000 |
|
Irrigations |
4.591 |
4.000 |
2.000 |
8.000 |
1.043 |
0.2273 |
0.4379 |
1.000 |
|
Spraying |
17.76 |
18.00 |
7.000 |
24.00 |
3.732 |
0.2101 |
-0.7877 |
5.000 |
|
Average plots size |
4.269 |
4.250 |
0.8750 |
10.00 |
2.150 |
0.5036 |
0.3866 |
3.500 |
|
Proportion of modern orchard |
49.26 |
54.19 |
0.0000 |
100.0 |
41.487 |
0.8422 |
-0.0417 |
100.0 |
|
Extension |
1,52 |
1,00 |
1,00 |
4,00 |
0,629 |
0,4141 |
1,0437 |
1,000 |
The first approach of estimating the technical efficiency is to estimate the production model with all potential production factors, using the conventional Cobb-Douglass function. Based on this model we estimate the technical efficiency TE scores for each farm. At the end, taking TE as dependent variable and efficiency factors as independent variables we estimate the TE model.
Based on (Kambo et al., 2018a) the conventional model describing relationship between production and its major inputs all in log form is shown in Table 3.
In their paper (Kambo et al., 2018a) based on the same data set showed that farm labor, resulted insignificant and has not been included in the model. We argue that under the Albanian conditions, where small farms predominate and workforce is abundant and underemployed, this result was also expected. Machine use as a proxy for the amount of farm capital also resulted insignificant. This result was expected; almost all apple farms use in an almost standard way irrigation and spraying pumps.
The regression coefficients are production elasticities. Thus, if apple area is increased by 1%, production is expected to increase by 0.55%, fertilizers’ use, irrigation and spraying remaining unchanged. If fertilizers use is increased by 1%, production is expected to increase by 0.19%, apple size, irrigation and spraying remaining unchanged; if spraying number is increased by 1%, production is expected to increase by 0.44%, fertilizers’ use, irrigation and apple size remaining unchanged; if irrigation is improved by 1%, then production is expected to increase by 0.38%, apple size, fertilizing and spraying remaining unchanged. Antilogarithm of the model constant results about 441 kg, which formally is the apple productivity of a farm using just one dunum of land, one kilogram of fertilizers and implementing just one spraying.
Using the above regression coefficients as starting values for the Maximum Likelihood efficiency model estimation, we obtained the TE efficiency model as shown in Table 4.
If we compare estimation shown in Table 5 with results shown in Table 4 we can see that parameters of both models are similar in magnitude, but this is not to say that always it happens like this.
Now, using the Jondrow formula, as indicated by the methodology of SFA, we estimated technical efficiency sores (TE) for each farm. Descriptive statistics for the TE variable are presented in Table 5.
|
Table 5 – Efficiency descriptive statistics for the Cobb-Douglass model. |
|||
|
Average |
Median |
Minimum |
Maximum |
|
0,87759 |
0,88860 |
0,73875 |
0,95240 |
|
Standard deviation |
Coeff. of variation |
5% Percentile |
95% Percentile |
|
0,042117 |
0,047992 |
0,78713 |
0,92658 |
The average technical efficiency score results 0.88. This result means that on the average, the apple farms could produce (1-0.88)*100=12% more apple with the same amount of resources they have already used. The best farm has an efficiency score of 0.95 with a potential of 5% more production and the lowest efficiency score is 0.74, with a potential for 26% more production with the same amount of resources the corresponding farms used. The coefficient of variation of TE is 4.7%, while and the median is 0.89 meaning that half of farms have an efficiency score higher than 88%. The coefficient of variation of 4,7% shows that there isn’t too much variation in TE between farms, though the standard deviation of the inefficiency term (Su) shows that differences in TE between farms are significant.
Based on these results, the efficiency of apple production in the Korça district of Albania is good, if not very good. This result was expected, because the apple production in this area is among most developed, farmers are committed to, and the apple in this area is the main source of income for a large number of farmers. However, as other studies show (Kambo et al., 2018b) about 15% of the apple production is thrown away, because non-sold or rotten. If we subtract this figure from the average efficiency score of 88%, the results of 73% would be the real efficiency score, which of course is the real average score for the apple in the study area. This is of course an alarming situation, because farm resources such as land, fertilizers, farm labor etc., seem to be used very inefficiently. This calls for immediate measures to ensure all apple production is sold.
The second modeling option we applied is the translog model, using again apple size, use of fertilizers, irrigation and spraying are the major inputs determining apple production volume and the same inefficiency factors. In the translog model we included except for the four above mentioned production inputs their squares all their pair combinations, as well as the hypothetical efficiency factors. Using OLS estimates (not shown here) as starting values for MLE model estimation, the translog model results as shown in the Table 6.
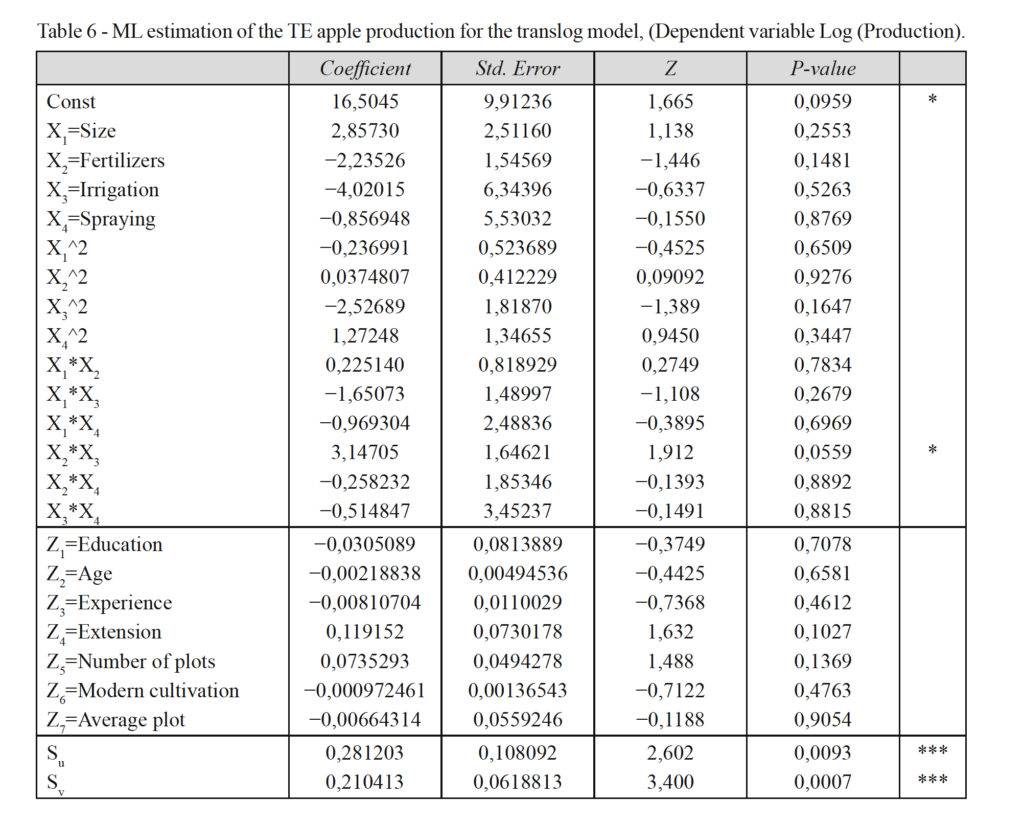
We can see that none of the production inputs results significant, and in some cases their effect is negative (fertilizers, irrigation, spraying) meaning a negative effect on the production volume. Only in the case of apple farm size the effect is positive and highly elastic. Squares of inputs and their combination (synergy) result almost insignificant (only the combination of irrigation and fertilizers results significant, but negative). All hypothetical efficiency factors results insignificant as well.
Using results of this model we calculated the composite error term (v-u) then based on Jondrow formula we calculated the technical efficiency for each farm. The average TE score for the ensemble of the farm sample and other descriptive statistics are as shown in Table 7.
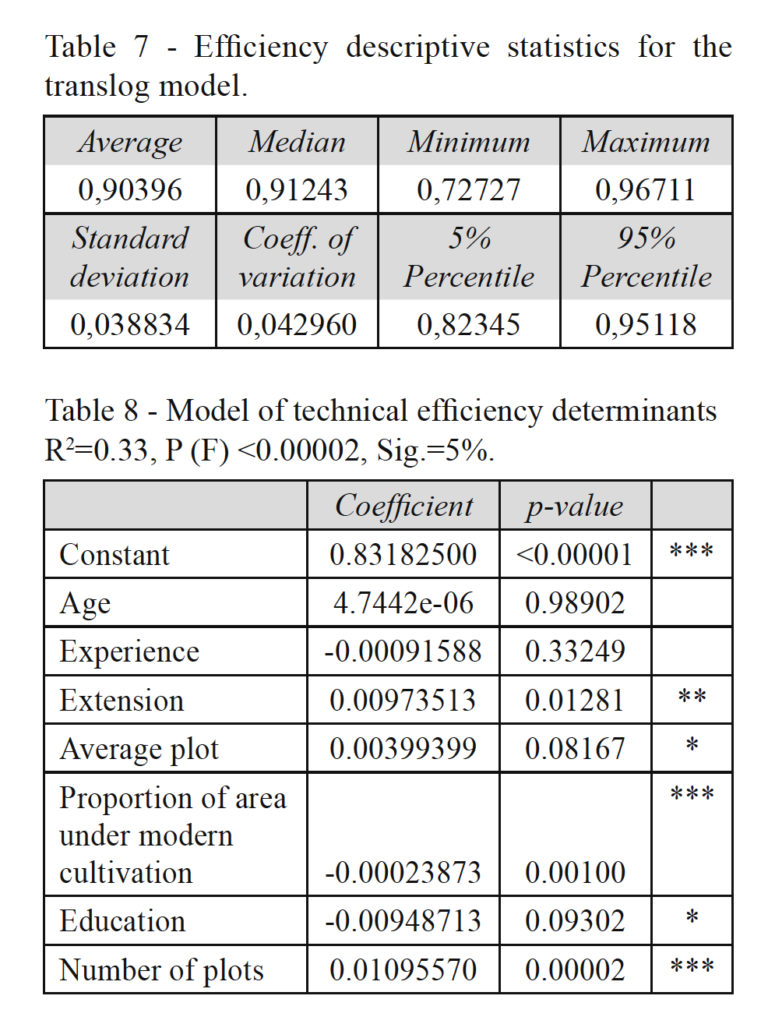
The aggregate TE level resulted 0.9. This means that an improvement in TE of 10% is possible with the same quantity of inputs already used. The minimum (worst) TE level is 0,73 or 73%, while the best is 0,97 or 97%. The median level of TE is 91%. The coefficient of variation 4,3% shows that there isn’t too much variation in TE between farms, though the standard deviation of the inefficiency term (Su) shows that differences in TE between farms are significant. The following table 6 shows other descriptive statistics for TE based for the translog model.
As an alternative, to identify and test the effects of apple production efficiency/inefficiency factors we use the conventional model. The estimated model of the technical efficiency is shown in Table 8.
If we take a significance level of 10%, the age and experience result insignificant; extension, average plot and number of plots results significant with positive effect on TE. Education and share of modern orchard result significant, but with negative effects on efficiency. As indicated by the coefficient of determination equal to 33%, a lot of efficiency variance is under control of other uncontrolled variables except for the ones included in the model.
4. Discussion
In our research we used two alternative models to assess the technical efficiency and identify factors of apple production efficiency. For the translog model we could identify two important problems: first, none of the inputs results significant; this is a misleading result, because we already know that four inputs have powerful positive and significant effect on apple production (Kambo et al., 2018a). Second, none of the efficiency factors is significant. This might be true but it might be also not true, as we know it is not true in the case of four inputs. In fact, when we regress efficiency factors individually on production some of them results significant (extension, number of plots and average plot). Furthermore all squared inputs and their combinations resulted insignificant. Technically, the reason for these results might be two: micronumerosity (few data compared to a large number of parameters to be estimated), and inclusion of irrelevant variables in their model. Our sample is small, and we have 24 parameters in our translog model. As Gujarati argues, micronumerosity has similar consequences with multicollinearity between the variables in the right-hand side of the model (Gujarati, 2003). We calculated the Variance Inflation Factors and found large values for them, indicating high degree of multicollinearity in the model).
Multicollinearity has two major effects. First, it inflates the standard errors of the model parameters, thus reducing the t-ratios and leading so to the non-rejection of the zero hypotheses (non-significance of parameters). Second, multicollinearity can alter the signs of the parameters from positive to negative and vice-versa, as it happened in our case with three inputs. The most common ways of dealing with multicollinenarity are dropping collinear variables or increasing the sample size. Inclusion of irrelevant variables in the model leads also to inefficient estimates (larger standard errors) for the model parameters (Gujarati, 2003). Because of inefficient estimates, some parameters may result insignificant. Because of this, all insignificant factors or combinations could be excluded from the model, what does nothing but leads to the rejection of the translog model and acceptation of the conventional model.. However, the translog model could be used to assess the aggregate level of efficiency, but we have shown that both models yield almost the same estimates of the TE level. Because of these results and as we tried to explain, we prefer the conventional model instead of the translog one, which also helps to estimate both the technical efficiency level and the role of efficiency factors, at least for the case in hand.
The number of apple plots in the Albanian small apple farms has a positive effect on production technical efficiency. This is in line also with findings from empirical literature (Moreira et al., 2011). The reason behind that might be that farms with more plots are more effective in avoiding environmental risks by producing in different places with different micro environment and, and they can reduce production risks also by planting different cultivars and applying different technologies in different plots. However this needs to be tested in another study.
The average plots size also has a positive effect on technical efficiency. This also seems to be in line with findings of literature (Coelli and Battese, 1996; Bozoğlu and Ceyhan, 2007; Moreira et al., 2011; Rajendran, 2014). Economically, larger farm plots may allow more effective use of machinery, water for irrigation and other inputs that may lead to higher efficiency, but dealing with this is beyond the aim of our research.
Farmers with larger proportions of apple cultivated under modern technology have lower technical efficiency. By modern technology one could mean better apple cultivars, new technology of spraying and irrigation, etc. We didn’t find in the literature research dealing specifically with this efficiency factor. We only can argue that the reason why the effect of this factor resulted negative might be lack or deficiency in other complementary inputs and services, such as fertilizers and extension in farms with high proportion of the factor.
Education seems to have a negative effect on technical efficiency. Empirical research in most cases shows a positive effect of education on technical efficiency (Coelli and Battese, 1996; Tzouvelekas et al., 1997; Rajendran, 2014; Hossain et al., 2015). In some cases education has been shown to have negative effect (Bozog˘lu and Ceyhan, 2007). In some other cases the effect is even neutral (Mohsen, 2017; Jara-Rojas et al., 2016). We argue that it is important the nature of education we talk about. In fact, when we talk about education, we have in mind formal or general education of farmers, not agricultural education. In this context it is not surprising a negative or neutral effect of education in the small apple sector in Albania; agricultural knowledge and skills would be more important than formal education.
Influence of age and experience on technical efficiency is not significant, otherwise it seem to be neutral in terms of effect. Findings in empirical literature support positive effect of age (Coelli and Battese, 1996; Lambarraa et al., 2007; Murtaza and Thapa, 2017), as well negative in some cases (Jara-Rojas et al., 2016); or even neutral (Mohsen, 2017). In relation with experience, the literature supports a positive effect but in some cases also a negative effect (Hossain et al., 2015).
Role of advisory services result positive, thus the third hypothesis is fully supported by evidence. This is in line with the bulk of empirical research (Khan and Saeed, 2011; Murtaza and Thapa, 2017; Dinar et al., 2007), but also neutral in some cases such as in (Jara-Rojas et al., 2016). However, there is much more to improve in advisory services for the Albanian apple sector. As shown in Table 2, the actual average sore for the access to and quality of advisory is only 1,52 (the maximum being 4).
Discussion with farmers and agricultural specialists reveal a number of important efficiency-related issues. For example some inputs mismanagement and ineffective implementation of apple growing techniques and technologies may exist, because of possible farmers’ limited management capacity, insufficient technical knowledge and skills. As an example, the moment of spraying is critical for its effect on apple, but not all farmers could be able to identify it if not enough supported by advisory services or not well equipped with necessary knowledge and skills. Or, as experts of the field affirm, optimal combination of fertilizers’ use with spraying is very critical in terms of apple productivity. Doing the right thing in the right moment and in the right way is extremely important to derive the maximum output from the amount of inputs used. Quality of inputs, as farmers frequently complain, may also be responsible for low effects of fertilizers and spraying on productivity and also efficiency. Uncontrollable factors, such as intensive rains and temperature fluctuations, as experts say, sometimes are difficult to control and may sometimes have tremendous negative effects.
Limitations of the study
This research provides only a general assessment of the aggregate level of technical efficiency in apple production in Korca area and some of its determinants. It’s not representative for all apple farming sector in Albania because other apple producing regions are not included. Because of the model used (Cobb-Douglass conventional model) this research doesn’t provide results on farm-specific production and substitution elasticities, what would be more helpful and indicative for policy intervention. Because of limited sample size, use of more efficient methods such as translog model was impossible and certain possible efficiency factors result insignificant. Larger sample could provide more efficient results and identify other determinants of apple production efficiency.
Though our focus was in some microeconomic and socio-demographic factors, other factors than those studied in this research may have an influence, as literature reveals, on apple technical efficiency. This could be the scope of another research.
5. Conclusions
Apple production in Albania is growing very fast, as it is having direct support from government and the country has good soil and climate conditions. But studies about technical efficiency are almost absent. The aim of this study is the assessment of an aggregate level of technical efficiency and its determinants in the apple farm sector of Albania. Data of for a sample of 150 apple farmers were collected and the Stochastic Frontier Approach was used. The general level of technical efficiency in apple production is estimated at 88%. This level can be considered relatively high. This means that with the actual state of technology, amount of land and other inputs used there is space for 12% more production. However, bearing in mind that about 12%, of the produced output is thrown away, because remains unsold or rotten, the general level of efficiency reduces to 76%, which is an average level however.
The efficiency farm-to-farm score range is about 21%, which means that for specific farms there is enough place for efficiency improvement. The median of efficiency is about 89%, meaning that half of the farm population is operating below the level of 89%.
Major determinants of technical efficiency is the access to and quality of the advisory services (extension). This results highlights the need to strengthen the system of service provision to farmers and use a bi-partisan public-private system, as suggested also by literature (Dinar et al., 2007).
Some socio-demographic factors, such as age and experience are not determinants of efficiency, which sometimes is in line with experience elsewhere in the world as empirical research shows (Jara-Rojas et al., 2016).
Education resulted a significant factor, but with negative effect. In relation to education, we argue that this result is quite possible, as far as with education as a factor here we understand the formal education of farmers (low, medium, university). In the apple farming, as it seems. what is needed more is not formal education, but apple-related knowledge as an ensemble of apple cultivation-related knowledge and skills.
Farmers’ apple-related experience has resulted insignificant factor, maybe because, as statistics show (see in Table 2 the coefficient of variation 4.2%) farmers’ population is enough homogenous in terms of experience and a few years of experience may not make much difference in terms of efficiency. Age also did not prove to be a significant factor, because age correlates with experience and we argue that it could but be effective but mainly through experience.
Extension as a soft knowledge proved to be very significant as a factor of efficiency, as expected and confirmed also by the relevant literature. But as results show, there is much to improve in relation with the access to and quality of extension.
The number of apple plots and average plots size have positive effect on technical efficiency. By planting apple in different locations, farmers can reduce production risk (pests, irrigation, or weather related), compared to the case where all apple is planted in one location. And larger average plot seemingly creates better possibilities for better use of farm inputs, thus higher efficiency.
Proportion of area under modern cultivation results negatively related with the level of technical efficiency, thus traditional orchards seem to be more efficient. This result is so maybe because modern orchard needs more skills and technical knowledge compared to traditional ones, and maybe farmers of modern orchard are not able need more technical support to manage a modern orchard.
Policy implications
Apart from improving productivity, use of intensive spraying could have negative externalities, such as soil, air and water pollution. Keeping environment clean and safe is as important as reaching high levels of efficiency. Therefore, supporting farmers with subsidies for the application of new technology to protect apple from insects, birds and atmospheric agents might be helpful in reducing spraying, and improving the quality of produce, while enhancing productivity and efficiency.
Adequate and regular training programs for apple farmers, and empowering public advisory services, are critical to increasing farmers’ management capacity and their technical knowledge and practical skills, for the application of new technologies, fertilizers and spraying in particular, but not only. Training and advice could be specific according age group, education level or farm size, as well as and region specific, to achieve desired results. This would ensure higher level of efficiency with lower input base.
Measures to improve apple-related technical and market information is crucial to help farmers to make good decisions about apple cultivars and technologies, as well markets to buy quality inputs and sell their produce. These could have an impact also on efficiency by producing more with same resources.
Government financial support should be given by priority to projects involving larger land plots, since these are more efficient than the smaller ones.
Scope for further research
Specific case-studies and brainstorming sessions with farmers and subject matter experts are needed to in-depth analyze best and worst farms in terms of efficiency, and reveal existing problems, as well as knowledge and skills gaps to better use resources that farmers dedicate to apple production. In particular farmers with modern orchard may have particular needs to better manage their orchards and make them more efficient. However a special study of the situation should be undertaken for the apple modern orchard to discover whether and why this orchards seems to be, ceteris paribus, less efficient than the traditional orchard.
This research having a pilot character, a more comprehensive analysis of efficiency of apple farm production in Albania is needed. This need is in both terms of wider regional coverage (other apple producing areas of Albania are not included in the research at hand) and size of sample. This could contribute to more representative country-level results, and larger set of indicators (such as farm-specific elasticity, or farm-specific scale elasticity, regional differences in technical efficiency, etc.).
Other possible efficiency factors exist and should also be identified and tested in the future. This would help to have a more complete framework of efficiency determinants in the apple sector. All these would help to design and propose more effective and region-specific policy measures enabling or helping farmers to use more efficiently their production resources.
References
- Aigner D., Lovell K., Schmidt P., 1977. Formulation and Estimation of stochastic frontier production models. Journal of Econometrics, 6(1): 21-32.
- Bhatt M.S., Bhat S.A., 2014. Technical efficiency and farm size productivity – micro level evidence from Jammu&Kashmir. International Journal of Food and Agricultural Economics, 2(4): 27-49.
- Bozoğlu M., Ceyhan V., 2007. Measuring the technical efficiency and exploring the inefficiency determinants of vegetable farms in Samsun province, Turkey, Elsevier. Agricultural Systems, 94: 649-656.
- Coelli T.J., 1995. A Guide to Frontier version 4.1c: A Computer program for Stochastic Frontier production and Cost Function Estimation: Working paper 96/07, Centre for Efficiency and Productivity Analysis Dept. of Econometrics, University of New England, http://tarjomefa.com/wp-content/uploads/2017/07/7209-English-TarjomeFa.pdf. Accessed on 12 November 2017.
- Coelli T.J., Battese G., 1996. Identification of factors which influence the technical efficiency of Indian farmers. Australian Journal of Agricultural Economics, 40 (August): 103-128.
- Coelli T.J., Prasada Rao D.S., O’Donell C.J., Battese G., 2005. An introduction to Efficiency and Productivity Analysis, 2nd ed., New York: Springer.
- Debertin D.L., 2012. Agricultural Production Economics, 2nd ed., Amazon Create space.
- Dinar A., Karagiannis G. and Tzouvelekas V., 2007. Evaluating the impact of agricultural extension on farm’s performance in Crete: A nonneutral stochastic frontier approach, Agricultural Economics, 36(2): 135-146, Doi.org/10.1111/j.1574-0862.2007.00193.
- Farrell M., 1957. The Measurement of Productive Efficiency. Journal of the Royal Statistical Society, Series A, 120: 253-281.
- Gretl User’s Guide 2012.
- Gujarati D.N., 2003. Basic Econometrics, 4th ed., Columbus (OH): McGraw-Hill.
- Hossain M., Alam A., Uddin K., 2015. Application of Stochastic Frontier Production Function on Small Banana Growers of Kushtia District, in Bangladesh Journal of Statistics Applications & Probability, 4(2): 337-342.
- Issacs A., Martin E. (eds), 1993. The Oxford Dictionary for the Business World. London: Oxford University Press and Market House Books.
- Kambo A., Osmani M., 2018a. Determinants of production and productivity in the small-scale apple farms of Albania-the case of Korça district farmers, The 6 th International Virtual Conference on Advanced Scientific Results (SCIECONF-2018), June 25-29, 2018 (www.scieconf.com, Slovakia).
- Kambo A., Osmani M., 2018b. An evaluation of apple production waste in the municipalities of Korca and Devoll and some related issues. In 2nd International Conference on Agriculture and Life Sciences, Agricultural University of Tirana, May 7-9, 2018, Tirana, Albania.
- Kashiwagi K., Kawachi A., Sayadi S., Isoda H., 2012.Technical Efficiency of Olive Growing Farms in Tunisia and Potential Demand for Olive Oil in Japan, Journal of Arid Land Studies, 22(1): 45-48.
- Khan H., Saeed I., 2011. Measurement of Technical, Allocative and Economic Efficiency of Tomato Farms in Northern Pakistan, International Conference on Management, Economics and Social Sciences (ICMESS 2011) Bangkok, http://psrcentre.org/images/extraimages/36.%201211541.pdf. Accessed on 12 November 2017.
- Jara-Rojas R., Bravo-Ureta B.E., Solís D., Martínez Arriagada D., 2016. Technical efficiency and marketing channels among small-scale farmers: evidence for raspberry production in Chile, International Food and Agribusiness Management Review: 1-14, doi: 10.22434/IFAMR2016.0168.
- Jondrow J., Knox Lovell C.A., Materov I.S., Schmidt P., 1982. “On the Estimation of Technical Efficiency in the stochastic Frontier Production Function Model”. Journal of Econometrics, 19 (2-3): 233-238.
- Lambarraa F., Serra T., Gil J.M., 2007. Technical efficiency analysis and decomposition of productivity growth of Spanish olive farms, Spanish Journal of Agricultural Research, 5(3): 259-270.
- Mohsen A., 2017. The technical efficiency of fruit production in Afghanistan. A case study of Logar province. Afghan Economic Society Publications, Volume 018 Bochum/Kabul, http://www.afghaneconomicsociety.org/index.php/publications/economics-publications. Accessed on 20 January 2018.
- Moreira V.H., Troncoso J.L., Bravo-Ureta B.E., 2011. Technical efficiency for a sample of Chilean wine grape producers: A stochastic production frontier analysis, Ciencia e Investigacion Agaria, 38(3): 321-329.
- Murtaza G., Thapa G.B., 2017. Factors affecting technical efficiency of small-scale apple farms in Balochistan Plateau, Pakistan, Journal of Mountain Science, 14(4): 782-794, doi: 10.1007/s11629-016-3937-z.
- Osmani M., Kambo A., Andoni M., Mosko A., 2017. Efficiency of vegetable production in Albania-a stochastic frontier approach, International Journal of Economics, Commerce and Management, 5(10): 1-17.
- Osmani M., 2017. Econometric Methods 4th ed., Tirana: Pegi Publishing House.
- Rajendran S., 2014. Technical Efficiency of Fruit and Vegetable Producers in Tamil Nadu, India: A Stochastic Frontier Approach, Asian Journal of Agriculture and Development, 11(1): 77-93.
- Sabasi D., Shumway R., 2015. Analysis of Technical Change, Efficiency Change, and Total Factor Productivity Change in U.S. Agriculture, School of Economic Sciences, Working Paper Series WP 2015-4, https://ideas.repec.org/p/ags/aaea14/170225.html, accessed on 23 November 2017.
- Simwaka K., Ferrer S. and Harris G., 2013. Analysis of factors affecting technical efficiency of smallholder farmers: Comparing time-varying and time-invariant inefficiency models, African Journal of Agricultural Research, 8(29): 3983-3993.
- Tzouvelekas V., Giannakas K., Midmore P., Mattas K., 1997. Technical efficiency measures for olive-growing farms in Crete, Greece, International Advances in Economic Research, 3(2): 154-169.