Abstract
The speed the present world changes, is at least impressive. During the last decade the global socio-economic environment faced major adjustments dictated by globalisation, technological progress and political interests. The European Union seems to fail in keeping up with the changing environment. Thus, if in 2007 the European Union represented 30.7% of the global nominal GDP, then in 2016 it accounted only for 21.7% (World Bank). The economic positions of the European Union have declined much as compared to the rest of the world the fact which inevitably leads to the decrease of the community’s political and economic strength. The main scope of the present paper is to assess the extent to which the economic security of the European Union has changed in the period of 2007-2017. At the same time, it has been proposed to identify the main subversive factors which affected the economic security of the European Union in the period of 2007-2017 and threaten the future perspectives of the Union. The results reached by the use of both qualitative and quantitative methods of analysis explicitly point out that economic security is decreasing and the identified threats menace the future existence of the European Union.
DOI: 10.30682/nm1902b
Augustin Ignatov*
Chief of Research and Promotion Department, Centre for European Integration Studies, Academy of Economic
Corresponding author: augustin1ignatov1@gmail.com
Cite this Item: Ignatov A., 2019. Analysis of the dynamics of the European economic security in the conditions of a changing socio-economic environment, New Medit, 18 (2): pp. 15-56, http://dx.doi.org/10.30682/nm1902b
1. Introduction
The speed the present world changes, is at least impressive. During the last decade the global socio-economic environment faced major adjustments dictated by globalisation, technological progress and political interests. The European Union seems to fail in keeping up with the changing environment. Thus, if in 2007 the European Union represented 30.7% of the global nominal GDP, then in 2016 it accounted only for 21.7% (World Bank). The economic positions of the European Union have declined much as compared to the rest of the world the fact which inevitably leads to the decrease of the community’s political and economic strength. Moreover, the diminution of economic influence of the European Union on the global arena reduces the degree of its economic security as the community risks losing foreign and internal markets.
Oxford dictionary defines security as “a state of being free from danger or threat”, in the context of this research economic security is identified as a condition or state of affairs of a country’s socio-economic environment which is characterised by stable welfare generation supporting the growing living standards. Economic security describes the ability of states to efficiently implement policies and strategies to reach the desired goals without being constrained by any external or internal threat. At the same time, this concept depicts a situation in which a single or a group of countries have a positive fundamental basis for growth i.e. prosperous and active business, investments in R&D, efficient bureaucracy, productivity and technological progress, growing capital formation, solvency, societal climate, etc. As it can be remarked, economic security is a wide concept comprising multiple aspects, some countries, for instance, can have strong positions in terms of productivity, technology, or GDP, yet having relatively weak economic security due to high levels of public debt which undermines its development perspectives and the capacity to generate further growth i.e. Italy, Spain, France and United Kingdom. Other countries could have both high economic efficiency, technological progress and strong institutions as well as low levels of public debt, yet being affected by demographical challenge i.e. Germany. Simultaneously, some nations can register favourable evolution in terms of debt, economic development and productivity, yet being affected by corruption and weak entrepreneurial culture and institutions the fact which determines low economic security, for example Romania, Bulgaria or Poland. At the same time, economic security in a group of countries can be hampered by development differences among countries which lead to weaker overall economic security. Moreover, economic security challenges tend to change over the time, thus if in 1950s-60s the main threats for the Western Europe were the expansion of communism, food security, and post war development, then at the end of 2000s the main challenge of the EU became the revival of EU’s economy in the conditions of growing globalisation. It is important to mention that other countries can have problems with economic security arising from severe ecological problems, for instance China (harmful industries, weak recycling capacities, high use of coal in economic processes), Brazil (deforestation), Canada (exploitation of oil sands) as well as from social-economic difficulties i.e. India, Nigeria and Mexico (growing slums concentration, pure water provision and sanitation issues) or from solely economic causes, for instance, growing protectionism in the USA. Accordingly, it can be observed that countries are facing various challenges which threaten their economic security, both at the global as well as at the level of the European Union, this situation depending on the specific environment which each country is characterised by. The challenges change over the years, and it is the responsibility of governments to build effective mechanisms of combating them.
The main scope of the present paper is to assess the extent to which the economic security of the European Union has changed in the period of 2007-2017. Thus, this aim is set to be achieved by quantitatively analysing the dynamics of the following indicators including central government debt, total (% of GDP), real GDP per capita growth rate, gross fixed capital formation, productivity performance, high tech exports % of total manufactured ones governance quality at the level of European Union member countries. At the same time, it has been proposed to identify the main subversive factors which affected the economic security of the European Union in the period of 2007-2017 and threaten the future perspectives of the Union. The goal will be achieved by qualitatively analysing the impact of corruption, excessive bureaucracy, weakening entrepreneurial culture, terrorism, organised crime, lack of strong leadership, eroding values, development gaps between the regions, raise of populism and migratory crisis upon overall economic potential of the European Union.
It is necessary to underline that the present research is addressed to the decision making factors of the European Union as well as of the national governments offering comprehensive analysis of the economic dynamics presented in an accessible form. Moreover, it is addressed to academic and business environments serving as a starting point for debates regarding the past, present and future perspectives of the European Union and its role in a globalised society.
2. Literature review
For a more comprehensive understanding of the issues related to national economic security reflected through the prism of governmental debt, GDP growth, capital investments, productivity, technology and institutions a subset of relevant literature was selected. Thus, according to Liapis et al. (2013) underlined that the last economic and financial crisis has shown that highly indebted European Union countries are economically vulnerable due to their weak financial and credit positions. Excessive public debt reduces the efficiency of governmental budgetary and fiscal policies since governments are constrained by growing economic fragility and risks. Thus, author concludes that the European Union needs a deeper coordination in the area of fiscal policy to minimise the heterogeneity of the economic environment. Furthermore, Panizza and Presbitero (2013) considered that excessive debt makes an economy susceptible to external shocks due to a higher degree of dependency. It may reduce the capacity of a country to increase its long run growth potential, yet this fact depends on the peculiar economic features of each country. There are specific thresholds defining the debt-economic growth relationship. In such a way, keeping the debt under control within certain limits fosters country’s economic development. The same idea is underlined by Reinhart and Rogoff (2010) who mentioned that increasing the level of public debt as related to the total size of an economy exceeding a certain limit is detrimental to the long run development. This fact results from the undermining effect of excessive debt upon the economic processes. Moreover, each economy has specific debt tolerance ceilings which once being overrun can destabilise the macroeconomic environment through interest rates and servicing costs. At the same time, Streeck (2014) determined that excessive public debt in the conditions of weak economic development, rising unemployment and accentuating tax resistance diminish the capacity of an economy to resist to the financial and economic fluctuations the fact raising the risk of stagnation. Simultaneously, Égert (2015) highlighted that excessive public of over than 90% of the GDP certainly makes an economy less flexible and hampers its development perspectives. Nevertheless, the degree to which it undermines the economic potential depends on the peculiar economic features of each country. Meanwhile, Fincke and Greiner (2012) said that debt policies should be suited to meet the particular interests of each state. However, the rise in the level of indebtedness should be carefully monitored and controlled since it makes a country’s economy more dependent upon the external environment. Finally, Lane (2012) argued that the excessive indebtedness of several Eurozone states threatens the economic stability of the Union as a whole since these countries have increased level of economic fragility. This situation worsens in the conditions of an absence of banking union and European level buffer mechanisms.
According to Haggard and Tiede (2011) a nation must ensure that its economy has favourable conditions to prosper and develop. This fact is essential taking into account the fierce global economic competition. Moreover, Naudé (2010) mentioned that propitious entrepreneurial environment is of key relevance considering economic growth. A country only succeeds to develop economically and socially if it assures favourable climate for business. Furthermore, McKinnon (2010) determined that capital determine the capacity of countries to produce welfare and share it among different participants of economic life. Moreover, the availability of financial resources as well as of capital enforces the ability of nations to realize their interest on external markets through providing more attractive opportunities. Simultaneously, Wennekers (2010) et al. said that the strength of business environment is crucial in realizing the main functions of a state and ensuring that its interests are respected. Consequently, the degree of efficiency and complexity of entrepreneurship (its capacity to generate new products, processes and, therefore create new markets) in a country marks the ability of government to act and address main challenges related to the development of the society and prosperity of the proper business. For instance, governments in developed nations characterised by efficient and complex business have more financial resources and human capital to achieve specific objectives as compared to the countries disposing of weaker business sector. Besides this, Fagerberg (2010) highlighted that economic development is an essential scope of countries across the world. One of the main determinants of growth is innovation which could have many facets i.e. high complex scientific outputs requiring qualified staff or product and marketing innovations based on ingenious ideas. Hence, the ability of nation to generate innovation in every field marks its capacity to growth and therefore to compete for markets and resources.
Meanwhile, Piketty (2015) stated that fixed capital is one of the determinants of a country’s capacity to foster its economic development as it comprises the fundamental basis for the economic operating environment i.e. infrastructure, machinery, industrial facilities, buildings, etc. The extent to which this basis is consolidated decides the potential of an economy to compete and grow. Accordingly, developed nations have strong operating environment which allows them to create more value added. Also, Robinson (2013) emphasized that the accumulation of capital is important to improve the capacity of generating new welfare. Simultaneously, technological progress assures the actuality of the generating power of capital. Thus, capital and technology are key components of the economic potential and competitiveness. Further, Ostry et al. (2011) accentuated that capital is a key component determining economic development. Nations registering higher capital generation are capable of increasing their economic output and productivity at a higher rate than those facing stagnation in this area. At the same time, Borio and Zhu (2012) determined that government should pay increased attention towards the formation of capital within country’s economy. It should approach these issues through developing proper capital, monetary and financial regulations. These areas should be under consideration to succeed in minimising capital investments risks. Moreover, Forbes and Warnock (2012) admitted that capital formation is sensitive to internal and external socio-economic and political risks. Nations aiming to develop intensive capital base should minimise the respective investments risks to ensure business a stable and steady environment. Finally, King and Levine (1994) underlined that the capacity of a nation to compete on the world’s markets is fundamentally connected with the ability of this nation to generate productive capital. Capital determines the improvement of this nation’ economic potential as related to the economic potential of other states.
Jorgenson (1991) mentioned that productivity is a key indicator defining the efficiency of an economy and its competitive edges. Moreover, it reflects the future economic growth potential and therefore the position the country will hold in the global value chains. Thus, innovation driven countries endowed with human capital and cutting edge technologies will hold more profitable niches in the global economy as compared, for example, to raw material exporting nations. Higher productivity allows developed nations to attract investments and economic resources, consequently, assuring higher living standards to the population. Besides this, Mankiw et al. (1992) has come to the conclusion that growth in productivity is essential in defining the overall dynamics of an economy. Productivity growth is determined by technology, quality of human capital and the level of capital accumulation. In such a way, productivity can be viewed as an indicator comprising key competitiveness areas which are reflecting country’s development potential. Moreover, Baumol (1986) pointed out that productivity allows competing rivalling economies by providing more attractive offers to potential consumers. Thus, productivity is a determinant factor of competitiveness defining the ability of a country to protect its own markets and win the foreign ones without imposing barriers of any kinds. At the same time, Timmer et al. (2011) marked that the dynamics of economic productivity in the European Union countries has declined since 1990s while in the USA the vice versa happened. This fact was caused by the failure of EU nations to reap the benefits of new economic markets including the ICT one. In the conditions of ageing population, low investments in risky innovation projects, rigid capital markets and over-regulation the productivity growth in the European Union will decline in relation to other global leaders. Furthermore, Hakfoort (1996) noted that an economy is only capable of developing if it constantly invests in enlarging its capital capacities and technology to keep up with the permanently changing environment. These investments are provided with the aim of keeping productivity in the competitive range able to bring the expected returns. Simultaneously, Galenson and Leibenstein (1955) highlighted that productivity is directly interconnected with the investments in capital as well as with economic development. Productivity is crucial in determining the level of economic security of states since those nations registering higher productivity have increased chances to win consumer markets than in the vice versa case.
Zelenika and Pearce (2011) pointed out that technology is determinative is assuring an economy economic advantages. It needs permanent adjustment to keep up with the changing socio-economic environment and raising competition. To reap the benefits of technological development, nations should overcome multiple barriers i.e. social, communication and economic ones. At the same time, Şener and Sarıdoğan (2011) underlined that the level of technological development of a nation determines its capacity to produce innovation in order to accomplish specific objectives and goals. Accordingly, technology is decisive in enhancing the economic and political positions and therefore plays a crucial role in enforcing nation’s economic security. In other words, technologies are possible arguments of a state in strengthening its competitiveness. Further, Popkova and Tinyakova (2013) determined that innovation and technology provides a new quality to the economic development of a nation allowing mobilizing most efficiently the existing resources to provide solutions to present and future challenges. Moreover, Ahlstrom (2010) highlighted that technology is the main driver of economic development since it allows reaching a totally new dimension of growth. Namely technology is the main contributor to the social prosperity. It is closely linked to business efficiency of a nation and competitive edges. Meanwhile, Cortés and Navarro (2011) concluded that technology determines the capacity of a nation to generate efficiency. Consequently, countries which intensively develop their innovative possibilities gain significant advantages in promoting their interest on the global markets. Finally, Ignatov (2017) mentioned that technology allows nations to make their economic potential stronger in the conditions of growing globalisation. Small countries as well as the bigger ones develop technologies through permanent innovation which is aimed to enhance their economic advantages and reduce their weaknesses.
Knack and Keefer (1995) underlined that governance efficiency is a determinative factor of economic growth as institutions form the operational environment in which an economy evolves. In these conditions, governance and institutions decides the degree of a nation’s economic competitiveness. Nyström (2008) comes to add that institutional quality determines the level of entrepreneurial activity resulting in more evident economic performance. Flattened government, efficient legal structure and increased protection of property rights guarantee melioration of business activity. Therefore, improvement in the institutional effectiveness results in more propitious development prospects. Moreover, Dixit (2009) highlighted that governance is set to coordinate economic processes for the best interests of all members of society i.e. business environment as well as population. It is important that government promotes its policies in impartial way neither favouring nor hindering interests of particular market players. Furthermore, Ben-Ner & Putterman (1998) determined that institutional effectiveness is crucial for economic competitiveness of nations. Thus, nations having more advanced institutions tend to have fewer barriers in their activity while those nations struggling with high bureaucracy and red tape regulation undermine their business competitiveness. Also, Powelson (2015) noted that government determines the operational framework of a nation. In these conditions, countries seeking to improve their competitive edges should pursue first of all enhancement of their institutions. At the same time, Bosma et al. (2018) concluded that when governance pursues and promotes the interest of business and population in its policies it is generally assessed as effective and, respectively, weak in the case when governance follows its own interests in detriment of the general public. According to Young (2015) the decision making process is highly bureaucratised in the European Union the fact increasing economic rigidity. Moreover, there is excessive involvement of the institutions in the economic processes both at the level of the community as well as in most of the EU nations.
In the case of the European Union, there are several common cultural features called “European culture”, for instance, according to Liñán & Fernandez-Serrano (2014) “autonomy and egalitarianism clearly predominate over embeddedness and hierarchy, while harmony tends to prevail over mastery”. Taking into account the ideas exposed by Liñán & Fernandez-Serrano (2014), it can be concluded that some of the European Union countries are more oriented towards developing business while the other meet difficulties linked to people’s biasness, lack of entrepreneurial knowledge and competences as well as traditions.
It is important to mention that each of the factors analysed i.e. public debt, efficiency and complexity of entrepreneurship, fixed capital generation, dynamics of productivity, technology, innovation and governance affects economic development of nations being key elements of their economic security. At the same time, it must be highlighted that each of these elements affect the other ones since the economy functions as an integral system. For instance, both fixed capital and productivity are linked to economic growth, but they are also linked to each other. If more resources are allocated to fixed capital, productivity edges will increase as well, due to the fact that, for example, new equipment leads to higher operational capacity and greater output. The same observations can be made considering the remaining factors, since a favourable evolution in one area will result in positive spill-overs in the other i.e. efficient governance motivated entrepreneurs to undertake riskier projects which can result in new technologies. To exploit this innovation, new infrastructure is developed resulting in higher fixed capital generation, the technology alongside with the infrastructure leading to higher productivity, thus more welfare is created and more taxes are accumulated, the fact minimising the need to raise the level of public debt. As an overall result, the economy as a whole, government and population are better off. These economic interdependencies are exemplified in economic growth models i.e. Solow-Swan model (stressing the importance of technological progress, capital accumulation and productivity), Joan Robinson’s model of growth (marking the importance of efficient income distribution and capital accumulation), endogenous growth model (mentioning the strategic importance of technology, knowledge and human capital).
As a result, it can be underlined that measuring economic security through the prism of governmental debt, GDP growth, capital investments, productivity, technology and institutions proves to be relevant as there are reflected key economic areas of strategic importance for the efficient integration of nations in the global value chains and their competitive edges. The present paper aims to examine the dynamics of these economic security indicators at the level of European Union countries taking into consideration the period of 2006-2016. Therefore, it is possible to assess whether the European Union and, consequently, its member countries are moving socially and economically in the right direction as well as to determine if economic security of EU has generally improved or the community and its member states during the researched period have become more vulnerable under the pressure of the economic security threats and challenges later identified in this paper.
3. Methodology
The present paper is based on both qualitative and quantitative analyses of data related to the economic performance of the European Union’ states. Qualitative assessment is applied to identify the main challenges which are presently faced by the community’s member states and determine the degree to which these challenges can undermine the future European economic security. This evaluation is directed towards mapping main socio-economic threats and ordering them according to the level of the subversive potential. Accordingly, the paper identifies corruption, excessive bureaucracy, weakening entrepreneurial culture, terrorism, organised crime, lack of strong leadership and eroding values as the main perils to the European economic security. It is necessary to add that there are other important threats hampering economic security in the European Union i.e. development gaps between the regions, raise of populism and migratory crisis, these are fundamental risks as well from the perspective of the present research since these lead also to the erosion of overall economic security of the community’s member countries.
Further, quantitative assessment is applied to appreciate the dynamics of overall economic security level by investigating the evolution of the following countries’ indicators in the last decade (2007-2016): central government debt, total (% of GDP); real GDP per capita growth rate; governance quality; productivity performance; high tech exports % of total manufactured ones and gross fixed capital formation. By performing this analysis, it is intended to appraise the degree to which the economic positions of the European Union’s member countries have changed since 2007. It is necessary to underline that there is a double approach towards assessing the countries’ dynamics. First, it is noticed the evolution in comparison with the previous year and second, it is investigated the degree to which each country’s indicators surpass the same year European Union’s level. Thereupon, for each indicator registered by the EU countries it is assigned 1 if the evolution is favourable in comparison with the previous year and 0 for the vice-versa case. At the same time, it is compared the values registered by each country with the same year value recorded by the European Union, and in case the country’s evolution is more favourable then it is assigned 1 or otherwise 0. When examining the evolution of real GDP per capita growth rate, instead of examining the evolution as compared to the previous year, it is assigned 1 only in the case when the growth rate exceeds 2% a year and 0 in other cases (2% threshold marks the average long term tendency of economic growth of the European Union registered within the last 30 years, 1987-2017, a period covering a whole infrastructural investment cycle). As a result, for each indicator examined and country it is received n number of favourable dynamics, marked with 1 and m of unfavourable pointed with 0 from a respective dataset d which comprise the period of 2007-2016 and 28 EU countries. Consequently, it is calculated the average a=(n+m)/d, with the maximum value of 1 and minimal one of 0. The value of a represents the degree to which the dynamics of the selected indicators of economic security is favourable or not with the perfect evolution in case of 1 and vice-versa in case of 0. The overall by country economic security performance is assessed by finding out the respective average comprising each dataset. The evolution at the level of the EU is calculated by identifying the by year average of all states. For instance, the dataset comprises the 2007-2017 period (or 2016 depending on data availability). During this period, for each of the indicators is calculated the dynamics in comparison with the previous year and the same year EU’s average. For each value of a specific indicator in a given year is assigned – one value of 1 if a specific indicator is favourable in comparison with the previous year and another value of 1 if this year’s value is higher than EU average. Thus, consider for example debt score. We have for each country the following years 2007, 2008, 2009…, 2017, in total 11 values. Thus, the maximum points, or the ideal situation is when a country registered only growing dynamics exceeding the previous year as well as the EU’s one, thus accumulating 22 points. The score of dynamics of this country will be 1. Nevertheless, this is an ideal case, yet in reality, this value will be comprised within 0 and 1, the fact which follows the rules of fuzzy logic. Thus, if the figure 1 related to debt score is observed, then it can be observed that country with the best evolution is Denmark, registering a score of 0.833, the fact meaning that in 83.3% of cases, the dynamics of this country was favourable both in relation with the previous year as well as the European Union’s average. Finally, the correlation coefficient between by country indicators is analysed to determine the degree to which these indicators’ dynamics are interrelated. In such a way, it is possible to understand in a more comprehensive way the framework of interdependence between the components of economic security. Through performing correlation analysis, it is aimed to quantify the direction and strength of the linear association between the various components of economic security. Also, it is expected to identify the direction of association, i.e. positive or negative, as well as the strength the datasets associate. By assessing the linear relationship between the variables, the strength and direction, it is possible to create a more comprehensive picture of the research matter. It is important to mention that no causal relations are aimed to be identified, since correlation does not provide this opportunity. The correlations are only drawn to make assumptions about evolution of the indicators’ dynamics. Thus, there can be developed more feasible policies offering coordinated solutions to the issues related to economic development.
The methodology used permits to take into account each positive or negative value of the evolution of the assessed economic security indicators and therefore come with a quantitative measure explicitly describing the general trend. In such a way, it can be determined the economic security dynamics and therefore take appropriate policy measures to reach specific objectives. Accordingly, there have been formulated two research hypotheses including HA and HB. Thus, HA states that the level of economic security of the European Union has declined in the last decade. At the same time, HB underlines that the threats identified represent considerable risks to the community’s economic security.
4. Results
4.1. Assessing the evolution of the economic security of the European Union in the period of 2007-2017
4.1.1. Debt score
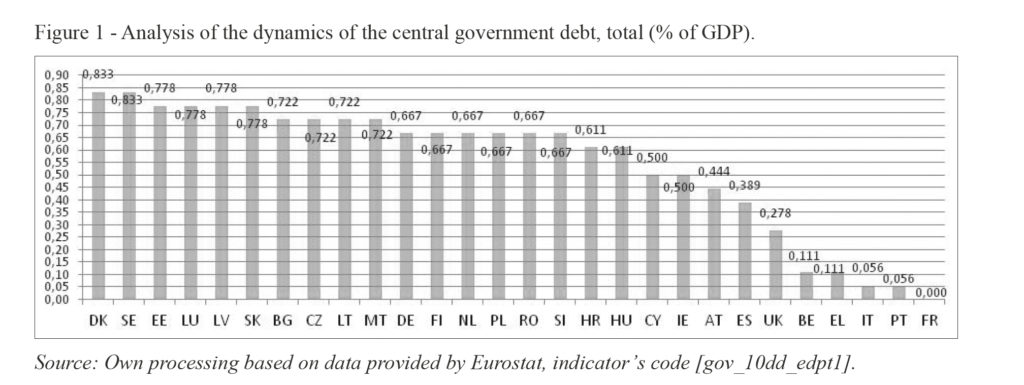
Sovereign debt is a key factor determining the level of economic security of a state. It is an important source to finance state’s activities and if borrowing with moderation, this can improve economic growth and as a result higher development of the society. Too much governmental borrowings as compared to the country’s GDP can worsen economic attractiveness causing a wide range of problems. High level of debt as related to GDP makes the economy vulnerable in front of external financial and economic shocks since it decreases the ability of the state to take additional credits or it risks paying burdensome interest. Moreover, high debt to GDP ratio can make an economy weaker since it can cause the raise in taxation rates, boost of inflation or cut of governmental spending. As a result, an economy can slow down and stagnate. Therefore, sovereign debt is crucial in determining states’ economic security and the control of it plays a strategic role in countries’ economic policies.
According to the information provided in the figure 1 it can be observed that Denmark and Sweden are the European Union countries with the debt performance of 0.833 from 1. These states are followed by Estonia, Luxembourg, Latvia, Slovakia, Bulgaria, the Czech Republic, Malta and Lithuania with an index of 0.722. From the perspective of this paper, the previously mentioned nations are the most secured considering central government debt. At the same time, there are countries with high performance in terms of debt starting with Germany (0.667) and finishing with Hungary (0.611). The European Union states registering middle range performance are Cyprus and Ireland (0.500) and Austria (0.444). Finally, it can be underlined that France, Portugal, Italy, Greece, Belgium, United Kingdom and Spain register the lowest performance in terms debt having the weakest dynamics. Accordingly, these nations are the most vulnerable in terms of debt decreasing the level of overall security of European economy from this perspective. Thus, it can be observed that the second, third, fourth and fifth economies of the European Union according to the size of the GDP record unfavourable dynamics in terms of dept. Worth mentioning is the fact that the Eastern European nations which integrated into the community in 2007 and 2004 register favourable evolution of the central governmental debt.
4.1.2. Real GDP growth score
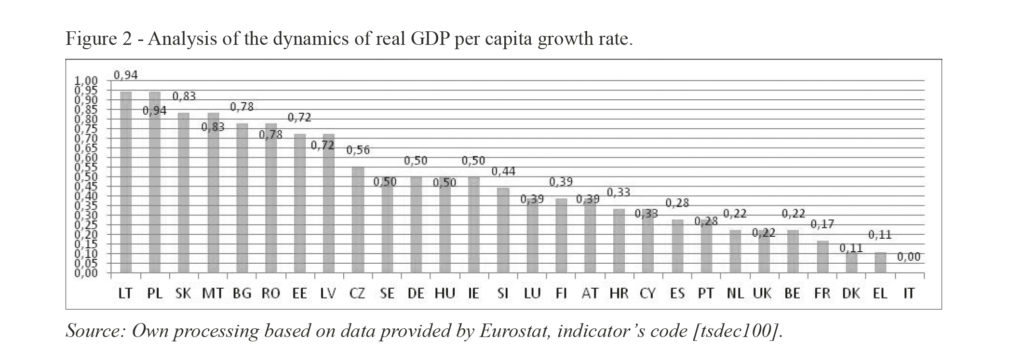
Real GDP growth rate is a macroeconomic measure reflecting the evolution of economic output of a country excluding the influence of inflation or deflation. Thus, this indicator permits assessing the actual size of welfare provided by an economy during a certain period of time. In such a way, by adjusting the money-value measure of nominal GDP it can be obtained a measure of general economic output. Taking into account these facts, it is necessary to underline that real GDP growth is crucial for the economic security of a state it reflecting growth of national income, of production capacity, productivity, employment and shows how healthy and dynamic an economy is. Generally, a higher level of real GDP determines increased living standards for the population which is the main goal of an advanced economic system as well as highlighting its competitiveness level.
The information regarding the analysis of the dynamics of real GDP per capita growth rate is depicted in the figure 2. Consequently, it can be remarked that Lithuania and Poland register the highest scores in terms of real GDP growth (0.94). These states are followed by Slovakia, Malta (0.83) as well as Bulgaria, Romania (0.78), Estonia and Latvia (0.72). Middle range performance in terms of the dynamics of the real economic output growth has been recorded by the Czech Republic (0.56), Sweden, Germany, Hungary, Ireland and Slovenia (0.44). At the same time, it can be pointed out that 14 European Union states out of 28, including the second, third, fourth and fifth economies of the community according to the size of GDP meet stagnating dynamics of this indicator. These countries i.e. Italy, Greece, Denmark, France, Belgium, the United Kingdom, Netherlands, Portugal and Spain, etc., are the most vulnerable from the perspective of economic development. Furthermore, it can be observed that the Eastern European Union countries registered secure dynamics of real GDP growth.
4.1.3. Fixed capital investments score
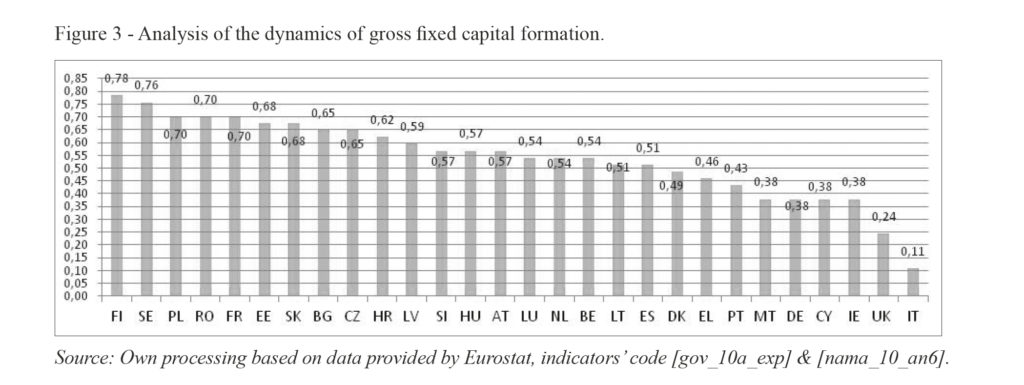
An important indicator for the economic security of a country is the gross fixed capital formation it reflecting the evolution of economic fundament on which a nation is based. It measures the size of acquisitions of fixed assets by the business sector, government and households, yet, in the present research only the first 2 were considered. This indicator is decisive for economic security since it reveals the evolution in the general infrastructure including roads, railways, social infrastructure i.e. schools, hospitals, commercial and industrial infrastructure, buildings, machinery, equipment purchases, construction of plants and so on. Accordingly, the higher is this indicator more probable is the economy to grow as it is offered a fundamental basis for development.
The figure 3 presents the analysis of the dynamics of gross fixed capital formation in the countries of the European Union. As it can be observed, the highest performance is registered by Finland (0.78), followed by Sweden (0.76), Poland, Romania, France (0.70), as well as Estonia, Slovakia (0.68), Bulgaria, the Czech Republic (0.65). Middle range scores are reported by Croatia, Latvia, Slovenia, Hungary, Austria, Luxembourg, Netherlands, Belgium, Lithuania and Spain as well as Denmark. Weaker middle range records are shown by Greece (0.43), Portugal, Malta, Germany, Cyprus and Ireland (0.38). At the same time, the weakest dynamics are characteristic for Italy (0.11), United Kingdom (0.24). The relatively low performance in the gross fixed capital dynamics (scores lower than 0.50) demonstrate that the countries are not forcing the formation and improvement of new socio-economic infrastructure this fact decreasing the countries’ long run economic competitiveness which has negative consequences over the economic security since the economies are left without fixed capital support. As a result, states’ economies become more vulnerable.
4.1.4. Productivity score
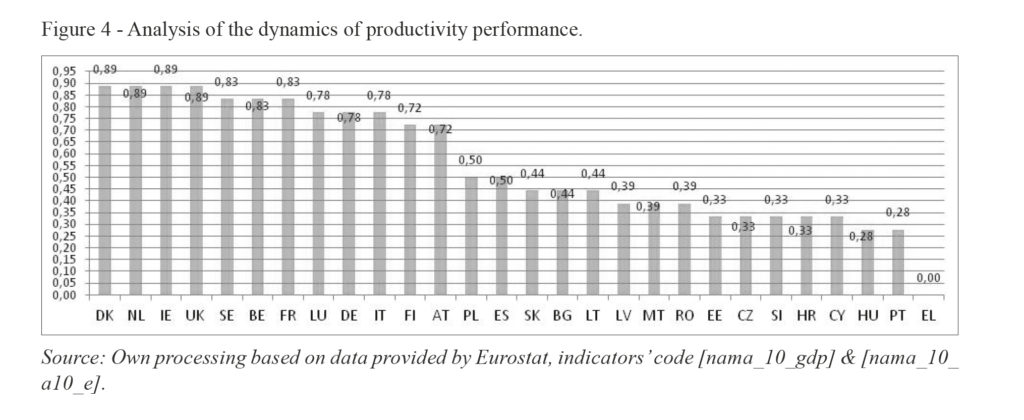
Productivity is a key indicator of economic performance and security reflecting the efficiency of states’ businesses and government. Countries registering higher levels of productivity per unit of input used tend to have superiority over other nations since its economic potential is adjusted and capable of providing more feasible outputs. Moreover, productivity determines the future capacity of an economy to prosper and grow. Positive dynamics of economic efficiency is a result of enhancements coming from technological, innovation and logistics improvements as well as from the increase of human skills and competences. Melioration of productivity is a strategic endeavour of governments across the world since it leads to more competitive economic processes capable of offering higher standards of living and output as related to the quantity of input used.
As it can be observed in the figure 4, Denmark, Netherlands, Ireland, United Kingdom record the most favourable dynamics in terms of productivity (0.89). These countries are followed by Sweden, Belgium and France (0.83). Also, propitious evolution is reported by Luxembourg, Germany, Italy (0.78), Finland and Austria (0.72). Middle performance is characteristic for Poland, Spain (0.50) as well as Slovakia, Bulgaria and Lithuania (0.44). Most vulnerable economies from the point of view of productivity are Greece which registered during the researched period only negative dynamics and actual value smaller than the European Union’s average. It is followed by Portugal, Hungary, Cyprus, Croatia, Slovenia, the Czech Republic, Estonia, Romania, Malta, and Latvia raging between 0.28 and 0.39. It is necessary to underline that the countries from the Eastern European Union are among least performing nations in terms of productivity. This fact highlights that these economies make the community vulnerable from the point of view of productivity since it is weakened the whole Union’s economic efficiency edge. Furthermore, there are important discrepancies between the productivity dynamics registered by the first 10 best and least performing nations in terms of productivity dynamics, the fact menacing the harmonious development of the Union as a whole.
4.1.5. Technology score
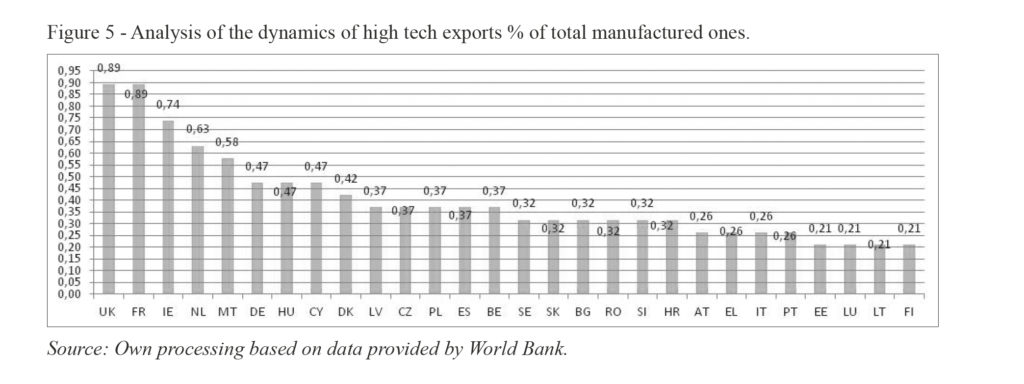
High technology is determinative in improving economic security of a nation. Countries which intensively exploit the benefits of innovation are more competitive and have increased adaptability capacity and are less vulnerable to external threats. Technology enhances economic potential through boosting productivity, efficiency and economic resilience. Moreover, innovation create high value added jobs, fosters the creation of human capital and creates more complex and advanced business relations, and economic processes which in contributed to overall competitiveness performance through developing technology integrated industries and services. Furthermore, it leads to the transformation of workforce significantly improving activities’ effectiveness. Innovation supports businesses in delivering more progressive products intensifying quality of living standards. Thus, technology is decisive in boosting economic security of states.
By analysing the information provided in the Figure 5, it can be marked that United Kingdom and France are the leading technology powers of the European Union registering the best dynamics and performance (0.89). They are followed by Ireland (0.74), Netherlands (0.63) and Malta (0.58) and so on. It is necessary to mention that the score reflects the dynamics performance and the relative position to the European Union’s average considering the weight of high tech exports in the total manufactured ones. By assessing this score, it is determined the efficiency of industrial sector taking into account the external competition since exports require high level of products’ performance. In these conditions, it is an imperative task for the European Union, in general, as well as for weakest European nations in terms of technology to take adequate measures to enhance states’ technological and innovation performance, particularly in the industrial sphere. The situation in this area should be warning for the decision making factors of the European Union since 23 out of 28 member states mark lower than 0.50, the fact characterising that the evolution in this field of these countries during the last decade was rather unfavourable.
4.1.6. Institutional score
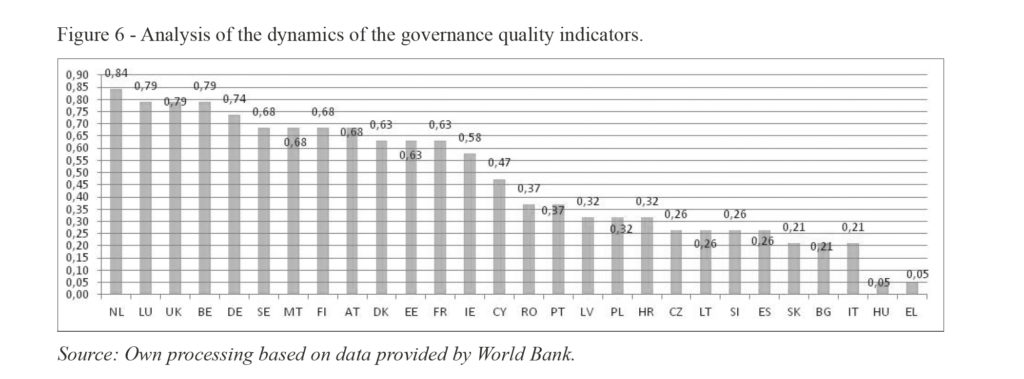
Governance performance is crucial in determining the level of economic security of a country. It shows the evolution of governance efficiency intermediating market relations and, consequently, determining economic competitiveness through the prism of institutions. The analysis of the dynamics of this indicator permits assessing the general evolution of country’s performance in terms of control of corruption, political stability and absence of violence, voice and accountability, government effectiveness, regulatory quality and rule of law. The assessment considers aggregated scores comprising all of these dimensions.
As it can be remarked in the figure 6, the dynamics and performance of the European Union countries in terms of governance quality is heterogeneous. Thus, the leading nations registering higher scores are Netherlands (0.84), Luxembourg (0.79), United Kingdom (0.79), Belgium (0.79), Germany (0.74), Sweden (0.68), Malta (0.68), Finland (0.68), Austria (0.68), as well as Denmark (0.63), Estonia (0.63) and France (0.63). Low dynamics performance is recorded by Croatia, Latvia and Poland (0.32), as well as Portugal and Romania (0.37). As a result, it can be underlined that the evolution in terms of institutional effectiveness in 15 nations of the European Union is rather unfavourable which marks serious deficiencies in the governance quality. Accordingly, the weakest states in terms of the institutional dynamics are the vulnerable spots of the community which can menace the future economic security of the European Union as a whole if the tendency is kept for the subsequent period.
4.1.7. Overall score
The overall score of the European Union’s economic security dynamics was assessed by calculating aggregated by country scores’ average comprising the following dimensions: debt, real GDP growth, fixed capital investments, productivity, technology and institutional performances. Accordingly, it can be underlined that the nations’ scores can be structured into four groups including high (0.55 to 0.65), middle (0.48 to 0.54), middle-low (0.40 to 0.47) and low (0.10 to 0.39) economic security performance (figure 7).
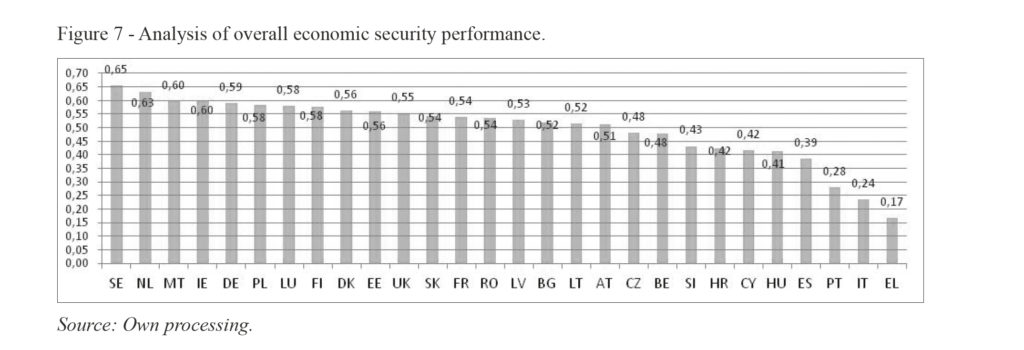
Thus, the first group includes the following countries i.e. Sweden (0.65), Netherlands (0.63), Malta (0.60), Ireland (0.60), Germany (0.59), Poland (0.58), Luxembourg (0.58), Finland (0.58), Denmark (0.56) and United Kingdom (0.55). These nations have relatively strong positions in terms of economic security. They register both favourable dynamics as compared to the previous years as well as compared to the overall dynamics of the European Union’s average in most of the cases. These states are less vulnerable to both external and internal shocks having an increased capacity to record economic growth. These states’ economies are characterised by a high degree of strength and being exposed the less to the economic risks in the community. Consequently, the second group of states comprise Slovakia, France and Romania (0.54), as well as Latvia (0.53), Bulgaria (0.52), Lithuania (0.52), Austria (0.51), the Czech Republic (0.48) and Belgium (0.48). They register a moderate level of economic security, their economic potential is strong, yet having certain weaknesses i.e. in terms of indebtedness, institutions, innovation potential, the fact hindering them from reaching the full potential of development. They lack prominence and economic excellence of the first group. Their advantages are related to well-balanced approaches in developing policies capable of minimising weaknesses and enforcing strengths, economic potential being efficiently calibrated. The third group embraces Slovenia (0.43), Croatia (0.42), Cyprus (0.42) and Hungary (0.41). These states register important weaknesses in terms of economic security, the effect of their policies upon its dynamics being limited. They are vulnerable in dealing with external and internal shocks being less flexible and efficient in boosting economic growth. These countries have a limited capacity in reframing their economic potential to enhance the development perspectives. They should tackle key obstacles which must be carefully identified to foster their current economic security positions. The last group which comprise the most vulnerable states from the point of view of economic security includes Greece (0.17), Italy (0.24), Portugal (0.28) and Spain (0.39). This group includes the nations which have suffered the most from the 2009 economic and financial crisis. Their economic security is the lowest among all nations, the dynamics being weak both in comparison with the previous years as well as EU’s average. These countries are the most vulnerable and need consistent support from other EU nations to succeed in combating stagnation and to boost their potential. These states’ growth potential seems to be exhausted and the policies which were implemented during the period have had limited effect. Accordingly, it can be observed that the Southern part of the European Union is its weakest region from the point of view of economic security. The North is the most secured economic region of the community. The majority of the Eastern European countries are positioned in the middle.
4.1.8. Evolution of overall economic security performance in the European Union
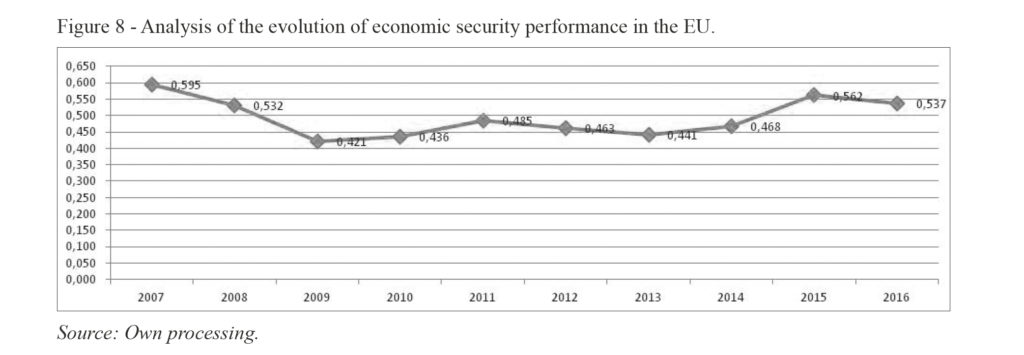
By analysing the evolution of overall economic security of the European Union it can be observed that the community has not recovered the positions held until the crisis. Thus, if in 2007 the overall index was 0.595 then in 2016 it represented 0.537 (fig. 8). Moreover, during the period of 2009-2014 it can be noticed a period of relative stagnation with values of the index accounting for less than 0.500. The highest position in the post crisis years was registered in 2015, 0.562 with negative dynamics for the next year. If assessing the extent to which economic security dropped in the period of 2007-2016, then it can be noted that the decline makes 11.6%. In such a way, it can be remarked that the European economy is struggling to revive, yet external and internal socio-economic factors constrains the growth and the policies developed in this regard has weakly helped. The EU’s economy has not efficiently reaped the potential of growth in the post crisis years, recovery taking a too long period and namely 6 years, 2009-2014. Even in 2016 the community has not exceeded pre-crisis levels of its economic security dynamics. It is important to underline that as long as the European Union’s economic positions stagnated, the world’s economy has grown with 44.5%. This fact demonstrates that EU’s economic positions have declined and a consolidation of single market is needed. Economically secured nations should provide considerable investments to the South and East of the community, these regions needing development projects in the area of infrastructure, technology and institutions.
4.1.9. Assessing interdependencies among the dynamics
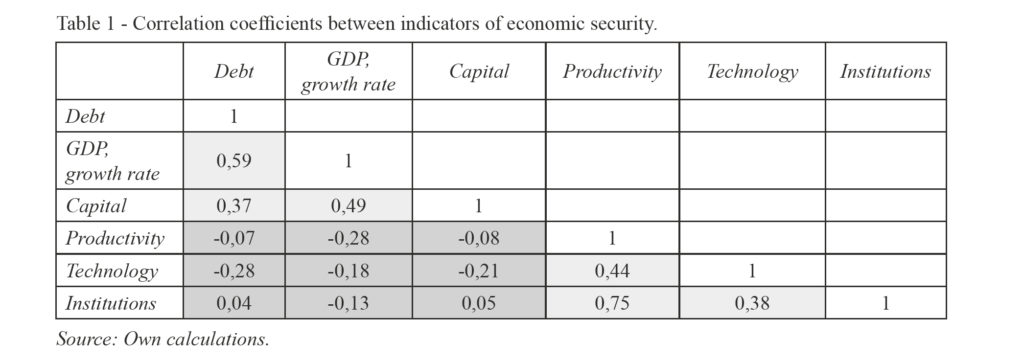
It has been calculated the correlation coefficient between the indicators of economic security to identify if there are any interconnections and if the dynamics of these indicators tend to follow the same growth tendency. In such a way, through performing correlation analysis it is aimed to confirm the existence of the relationship between the various elements of economic security and which is the extent of strength of this relation. Accordingly, it has been detected that there is strong relation between debt and GDP (0.59). Thus, the evolution of the dynamics GDP in the European Union is positively correlated with the dynamics of debt the countries incur. The situation becomes rather unfavourable if the expansion of an economy on the base on debt is oriented to current consumption. Simultaneously, debt can stimulate long run development and improve economic security of a nation if it is transformed into investments, including fixed capital ones. Consequently, it can be noticed that there is middle-strong correlation between debt and fixed capital formation of 0.37. This fact, demonstrates that there is a weak relation between these variables which allows inferring that most of the debt in the European Union is directed to short run goals rather than long run ones. There is a relatively strong correlation coefficient between GDP and Capital (0.49) which could be expected since growth or drop in the formation of capital leads to weaker evolution of GDP, fixed investments being an important part of the countries’ GDP. There is also a strong positive correlation coefficient between productivity and institutions (0.75). Put into a general perspective this fact demonstrates that an improvement of bureaucratic environment certainly leads to productivity growth and vice versa. Institutional environment is middle – strong correlated (0.38) with the technology performance of nations. In this case, an explanation could be the idea that institutional progress and innovation are mutually determined through the implementation of high technology in the bureaucratic processes. Final relatively strong positive correlation is assessed between productivity and technology (0.44). This positive relation demonstrates that the dynamics of growth in the technological performance of a country is positively linked with the dynamics in productivity (table 1). Weak correlation of any sign (positive/negative) is identified between productivity and debt (-0.07), GDP (-0.28), and capital (-0.08), technology and debt (-0.28), GDP (-0.18), and Capital (-0.21) as well as for Institutions and Debt (0.04), GDP (-0.13) and Capital (0.05). These weak relations underline the fact that productivity, innovation and institutions behave rather independently from debt, GDP and capital and these variables are not feebly interconnected.
4.2. Conceptual framework: Identification of the potential threats which can undermine the future economic security of the European Union
The present research identifies corruption, bureaucracy, declining entrepreneurial culture, terrorism, organised crime, weakened leadership, eroding fundamental values, present development gaps, raise of populism and migratory crisis as being the main menaces to the economic security of the European Union and its member countries. These threats have strong potential to undermine the community’s development potential acting as eroding factors of economic efficiency and competitiveness. They negatively influence all aspects of social, political and economic life of the member countries contributing to grinding the fundament of the European Union – the free market, the basis of competitiveness, growth, technological and innovative progress as well as efficiency. To be more precise, it is important to mention that all these threats discredit the ideas linked to the European Union menacing the existence of the community. For instance, corruption demotivates the business to develop and increase its efficiency edges. It destroys market mechanisms leading to worsening dynamics of the private investments the fact hampering economic development. The risks of corruption grow in a bureaucratised environment, where public sector has important influence upon economic processes. Alongside corruption, excessive bureaucracy can raise favouritism, nepotism and clientelism which also diminish the efficiency of an economy. Bureaucracy and corruption are two fundamental causes of declining business climate, creating networks hindering overall transparency of public funding allocation, promoting bribery, extortion, and embezzlement. At the same time, it is important to mention that the present European Union is affected by weak leadership & economic difficulties which cause a weaker adhesion of the population for the European values, which are also undermined by an erosion process fuelled by populism, accentuating development gaps, weak entrepreneurial culture, migratory crisis, organised crime, and terrorism. These challenges alongside corruption and bureaucracy threaten the proper existence of the EU. In the present form, the EU is limited in tackling all these threats, therefore, consolidation is required. In order to understand more comprehensively the influence of these threats upon economic security of the European Union, it is necessary to frame and perceive the community and the member countries’ social, economic and political aspects as whole and integral parts of a mechanism which we call the Europe. It is a system which includes people and values determining the way this people live and work, consequently, a change in one area will bring other changes in another. Thus, despite the threats identified may be different in nature and matter they certainly affect the degree to which an economy is secure, their influence coming from various directions.
Threat number 1: Corruption
Corruption is one of the main impediments towards the economic development of the Eastern and Southern European Union countries. It endemically affects each aspect of socio-economic and political life. Corruption in these regions of the European Union is widespread, the business sector and population suffering as well. Particularly dangerous is high to middle rank political and economic corruption it determining the effectiveness of strategic socio-economic decision making. In consequence, key resolutions on particular areas of development can be motivated by obscure interests and therefore leading to the realisation of individual goals rather than of general public. Moreover, rottenness of high to middle rank elites undermines the effectiveness of law enforcement as well as of the principles of law neutrality. Thus, the basic principle of a modern society, and namely the rule of law is eroding. Unfortunately, corruption is a core problem of the European Union and its eradication is stumbling.
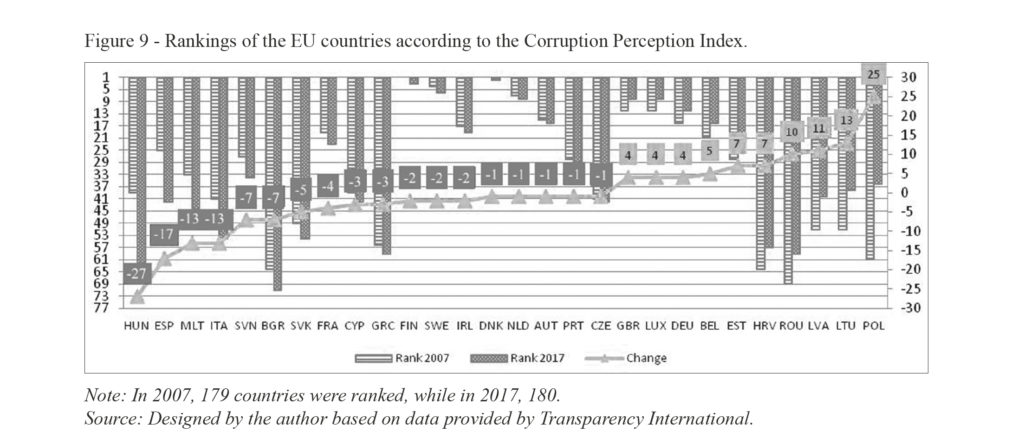
As it can be observed in the Figure 9, the countries of the European Union can be differentiated into four groups taking into consideration their performance in terms of corruption. Thus, the first group is formed by countries registering relatively high performance and insignificant change in their dynamics. The second group comprises the countries recording a weak evolution in terms of corruption irrespective of their rankings relatively high or low the key focus being the dynamics. The third group includes the advanced nations of EU in terms of corruption performance registering positive dynamics. The fourth group is composed from nations with low rankings in the rating yet having favourable dynamics or in other words succeeding in reducing corruption. It is of strategic importance that all the nations of the European Union continue to mobilise efforts in combating corruption. Yet, the nations from the second and fourth groups should pay particular attention to eradicating corruption since they are highly vulnerable from this point of view.
Threat number 2: Excessive bureaucracy
Excessive participation of the state in the economic processes reduces the competitiveness of the European economy which tends to become less attractive due to excessive taxation and regulation. European business is both subject to communitarian rules and national ones the fact determining increased pressure upon the entrepreneurship. The communitarians as well as the national actors are aware that reforms are necessary to enforce the liberalisation of the economy, yet, due to the lack of consensus and understating among the various groups i.e. EU and national governments, businesses, trade unions the process is hampered. Despite of the efforts made to enhance liberalisation, rigidity is still assessed in tax, goods, services and public procurements areas. Moreover, there are problems linked to mutual recognition of laws, this fact disrupting the efficient functioning of the single market. This research regards bureaucracy through the prism of governmental revenue % of GDP, or in other words, how much of the economic welfare created during a year goes to government. Thus, the higher is the participation the more the economy is state oriented and therefore a more important role the government will play in determining overall economic processes. It is important to mention that governmental revenue represents the totality of tax, non-tax and capital revenue perceived by state. High involvement of the state in overall economic activity determines its bureaucratisation since the decision making is transferred from the free markets to government.

Accordingly, it can be observed that despite of the efforts made by the European Union in the direction of liberalisation during the last period the involvement of government in the economy has growth with 1% during the period of 2007-2016 to reach 44.7% (figure 10). The countries with the highest level of governmental revenue % of GDP from the European Union are Finland, Denmark, France, Belgium, Sweden and Greece. At the same time, lowest values are characteristic for Ireland, Romania, Lithuania, Bulgaria, Latvia, Spain and United Kindom. For comparison, in the USA government controls only 32.9% of the economy (OECD, 2016). Thus, it can be observed that between the two entities of comparable economic size and population there is almost 12% difference in extent of governmental involvement in the economy. Considering that the nominal GDP of the European Union according to the World Bank (2016) is 16.48 trillion dollars, it means that the European Union’s business allocates $1.96 trillion more of economic welfare to government, thus, having less funding available for investments as compared to the US counterparts. In such conditions the businesses as the main contributors in the European Union are less competitive as compared to the USA due to the increased state interference into the economy. From this perspective, it can be generally assessed that there is an increased level of bureaucratisation in the EU hampering overall economic growth and reducing the competitive capacities of European business to compete globally.
Threat number 3: Weakening entrepreneurial culture
National culture is determinative in defining the entrepreneurial power of a nation which contributes to the creation of wealth and economic development. Nevertheless, the same source comes to underline there are a range of specific characteristics which is contributing to the division of the European culture into four groups. Consequently, Central and Northern Europe tend to share the same values and principles and be closest to stereotypical European culture while English speaking, Mediterranean and Eastern European nations have peculiar quiddities. National culture determines the extent to which entrepreneurship is favoured, as a result, the degree to which the socio-economic, political and institutional environment permits developing business activities without meeting barriers of any kind starting from bribery and finishing with excessive formalization. This fact is reflected by nations’ efficiency in developing business activities which is consequently assessed by various indexes including economic freedom, ease of doing business and economic competitiveness.
Figure 11 summarises the information presented in the Annex 1. By yellow colour there are counted the EU nations which record weak rankings in terms of specified indexes (not entering in the first 30 nations according to the ratings). Also, yellow colour determines negative change and the drop in the rankings. Consequently, green colour points out nations included in the first 30, as well as the countries which registered positive change or increase of the ratings. By analysing the economic freedom, it can be observed that 19 out of 28 nations recorded negative change of their positions in the rankings and also one country dropped out of the top 30. Economic competitiveness comes to underline the same dynamics of the change, but in this case two states dropped out of first 30 nations. Nevertheless, ease of doing business expresses that business environment improved in the EU since in 2007 there were only 12 countries (25 nations were ranked) and respectively 16 by 2017 in top 30. The change is also positive, 20 countries out of 25 ranked in both years improving their ranks. Annex 1 comes to complete the figure 11, by explicitly underlining the nations’ rankings and the extent of change.
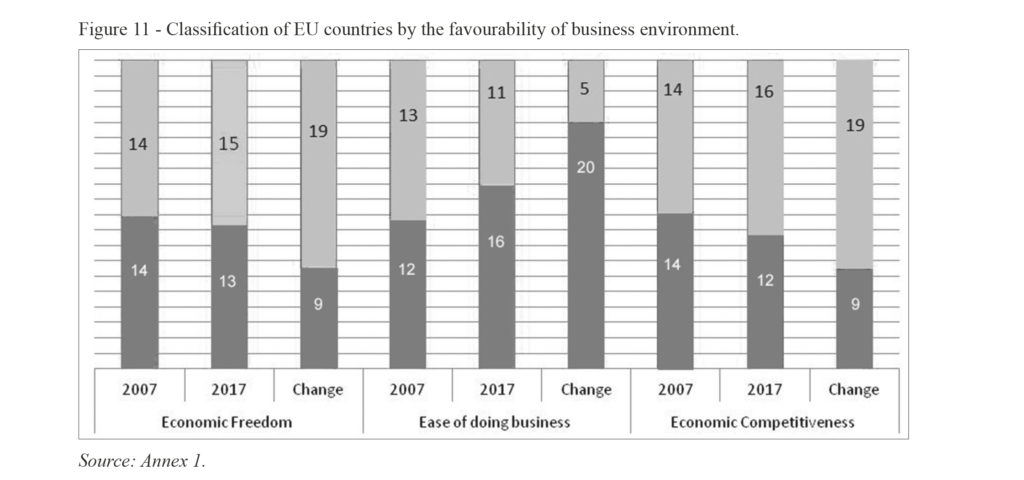
By evaluating these indicators, it can be underlined that the European countries have heterogeneous performances in terms of entrepreneurial environment efficiency. Thus, most of the Eastern European and Mediterranean countries have generally lower performances in the area of business as compared to the Northern and Western counterparts. Some Eastern European nations report positive dynamics, while the Southern part of the community is rather stagnating. If generally assessing the dynamics of European entrepreneurial efficiency, it can be noticed that according to two indicators out of three, 19 states out of 28 decreased their positions in terms of business efficiency at one or another extent. This fact underlines the idea that the entrepreneurial culture in the community is slightly eroding, the European Union losing ground. Moreover, if in 2007 the share of nations with relatively high business environment performance was equal to those having moderate one than in 2017 the proportion was changed in the favour of the last. As a result, it can be observed that entrepreneurial environment is slowly eroding and therefore the European business culture is weakening.
Threat number 4: Terrorism
The European Union has a relatively low capacity to combat terrorism within its borders as compared to the United States. Its institutional framework is not adapted to meet this challenge and excessive bureaucratisation reduces the chances of acting timely. Moreover, there is a low level of cooperation among the member countries in this area. The European Union certainly lacks unique institutions capable of coordinating anti-terrorism efforts and developing effective policies in this area. Terrorism is an important threat which should not be underestimated since it directly affects individual security of millions of Europeans.
According to Europol (2015-2017) in the period of 2014-2017 there have been committed 38 terrorist attacks in the largest cities of the European Union including Paris, Brussels, Nice, Berlin, Stockholm, Manchester, London, Barcelona and Marseille. In these attacks 349 civilians were killed and 2167 injured. Besides direct victims, it is the psychological impact upon the population which cannot be quantitatively assessed. In the conditions of growing terrorist threat, the European Union should consolidate its efforts and implement best international practices in this regard. The issue of community’s security is of key importance to insure that the European citizens are safe.
Threat number 5: Organised crime
Organised crime is one of the main threats to the economic security of the European Union. It undermines economic processes causing the erosion of socio-economic equilibrium. Organised crime disrupts economic competitiveness through its destructive effects upon institutions and social life. Organised crime includes human trafficking and sexual exploitation of women and children, drugs and arms trafficking, money laundering, corruption, and computer crimes, etc. These lead to the erosion of social values and raise of overall insecurity in the society. The present institutional framework in the European Union has several structural weaknesses occurring as a result of by country legislative heterogeneity. Supranational status of the EU institutions aimed to combat crime and lower than necessary cooperation at the inter-state level leads to the occurrence of legislative and enforcement gaps reducing the efficiency of efforts in this area. Europol (2017) mentioned that organised crime uses their illicitly obtained assets accounting for hundreds of billions to infiltrate legitimate economy. As a result, it represents an important threat to economic security which needs efficient control and eradication.
Threat number 6: Lack of strong leadership and eroding values
The European Union due to its heterogeneity lacks strong leadership capable of offering efficient solutions to the present and future challenges. The current institutional arrangements comprising two-tiers and namely national and supranational levels is impeding operative decision making process which results in stalemate situation in which one country can undermine the decisions of other 27 nations. Excessive decentralisation of power inside the community weakens its positions which in the conditions of feeble strategic orientation threaten the future development perspectives of the Union as an entity. In such a way, it can be highlighted that the debt crisis in Greece, Brexit, separatist atmosphere in Spain, and Russian expansion comes to point out that the community is lacking strong leadership capable of mobilizing efforts in an age of changes. This weakness is accentuated by the existence within the European Union of two speeds of integration, thus, on one hand there are countries members of the Eurozone and on the other hand the nations which did not adopted common currency, despite of meeting the membership criteria.
Moreover, lack of strong leadership and enforcement of the decision making process lead to the erosion of fundamental values on which the European Union is created i.e. respect for human dignity and human rights, freedom, democracy, equality and the rule of law. European identity which developed since the conclusion of the Agreement on Steel and Coal has suffered much in the second decade of the 21st century due to exaggerations and misinterpretations of values. Legality comes to contradict legitimacy as there are important legal differences among the countries of the community the fact contributing to the erosion of the European identity. Thus, according to Parlemeter (2017), a survey performed by the European Parliament to assess the people’s view about the European Union, the share of interviewees responding that the community is going in the “wrong” direction has increased from 23% in 2007 to 44% in 2017, while those who mention that the European Union is moving in the “right” direction dropped from 40% in 2007 to 31% in 2017.
Threat number 7: Development gaps between the regions
The 2004th, 2007th and 2013th waves of the European integration created socio-economic misbalances inside the community due to the development gap existing between the Western and Eastern member countries. Despite of different efforts aimed to reduce this disparity including Cohesion Policy, Europe 2020, the European Union failed in general to realise this goal since presently there is a high difference between the levels of the economic prosperity in the West and East. However, it is necessary to underlie that important steps have been made towards this direction since the disparities were reduced. Thus, the present EU is characterised by considerable disequilibrium in the socio-economic sphere. This differentiation undermines the possibility of the community to consolidated its economic potential and broaden the area of cooperation to reach increased output and competitiveness due to the fact that the environment is more plain. In such a way, the countries register significant gaps in the implementation performance of communitarian policies or strategies. Moreover, the differences are noticeable between the Northern and the Southern European Union countries, which accentuated in the post crisis years. In these conditions, the European Union risks to fail in the consolidation of its economic positions to enhance its competitive capacities.
Threat number 8: Rise of populism & migratory crisis
Populism menaces the proper existence of the European Union since it has already convinced the citizens of the United Kingdom to vote “leave” from the community. In the conditions when the Western European countries “opened” the doors for millions of non-European migrants, the threat of populism can grow, the fact already proved by the recent elections in Italy where the so called – populist party “Five Star Movement” pledging for “no migrants” scored 32.22% (1st place) and the far-right party “the League” supporting also the “no migrants” option scored 17.69% (The Guardian, 2018). Accordingly, the policies promoted by Germany, France and the Scandinavian EU nations in the area of migration lobbying them at the level of the European Union and imposing other states to implement them created strong divisions in the European society. The migratory challenge and the rise of populism are undermining the “unity” of the community alienating the European countries and their citizens from building a shared society.
5. Conclusions
By taking into consideration the results reached, it can be mentioned that the first hypothesis, HA, is accepted, it stating that the level of economic security of the European Union declined. Thus, the level of overall economic security in the community has dropped in the period of 2007-2017 with more than 10%. The Western European nations are the most economically secured countries in the EU followed by the Eastern European nations which integrated in the community in 2004, 2007 and 2013. The Southern counter-parts despite being more economically developed as compared to the Eastern ones are more economically vulnerable, the risk of being affected by external and internal shocks being higher. These countries registered the lowest levels of economic security. The Eastern nations were more balanced in promoting their economic policies the fact demonstrated by higher overall scores of the economic security indicators. It is important to highlight that the Southern and Eastern European Union countries need more comprehensive support of the Northern and Western partners. Specifically, this support should take the form of infrastructural and technological investments in these nations’ economies to boost their growth potential. In this way, consolidation of economic security and enhancement of these nations’ economies would strengthen overall economic potential of the EU making its economy more competitive on the global arena. Deepening cooperation between the North, West, South and East will lead to making all parties better off, since it is always beneficial in having a stable and prosperous neighbour with whom you can develop common business compared to a poorer one who has nothing to offer. The present research, also accepts, the second hypothesis, HB, it underlining that the threats identified represent considerable risks to the community’s economic security and future growth potential. Corruption, excessive bureaucracy, weakening entrepreneurial culture, terrorism, organised crime, lack of strong leadership, eroding values, presence of development gaps between the regions, raise of populism and migratory crisis, raise uncertainty regarding the development perspectives of the single market. Consequently, there should be undertaken several core reforms to tackle these menaces as well as to improve the overall competitiveness of the European Union in the conditions of growing globalisation. The community should pursue a wide optimisation process aimed to reduce economic waste especially in the public sector and invest in the development of its entrepreneurial sector in order to be competitive enough to re-boost its economic progress. Accordingly, by fostering institutional environment and innovation capacities of the business sector the European Union will be capable of enhancing its productivity capacities which in turn will empower overall economic competitiveness.
It is necessary to underline that the present research has several limitations including: besides the identified threats there are other factors influencing negatively the level of economic security i.e. unfair market competition. Also, an important element to the economy of a nation is its energy security which was not covered in this research and serves as a discussion to be analysed comprehensively in the future. Moreover, there were weakly presented the methods which can be applied to improve economic security in the European Union and tackle the main challenges. At the same time, it is necessary to underline that the correlation analysis applied does not allow identifying the existence of causal relations among the variables, it only providing an overview of the dynamics’ relationship. These directions can serve as important starting points for performing further research on these issues with the aim of enhancing the understating of the EU and national governments, academic society as well as interested individuals upon economic security in the European Union.
References
- Ahlstrom D., 2010. Innovation and growth: How business contributes to society. The Academy of Management Perspectives, 24(3): 11-24.
- Baumol W.J., 1986. Productivity growth, convergence, and welfare: what the long-run data show. The American Economic Review, 1072-1085.
- Ben-Ner A., and Putterman L., 1998. Values and institutions in economic analysis. In Economics, values, and organization, Cambridge, MA: Cambridge University Press, 3-69.
- Borio C., and Zhu H., 2012. Capital regulation, risk-taking and monetary policy: a missing link in the transmission mechanism?. Journal of Financial Stability, 8(4): 236-251.
- Bosma N., Sanders M., and Stam E., 2018. Institutions, entrepreneurship, and economic growth in Europe. Small Business Economics, 1-17.
- Corté, E.A., and Navarro J.L.A., 2011. Do ICT influence economic growth and human development in European Union countries?. International Advances in Economic Research, 17(1): 28-44.
- Dixit A., 2009. Governance institutions and economic activity. American economic review, 99(1): 5-24.
- Égert B., 2015. Public debt, economic growth and nonlinear effects: Myth or reality?. Journal of Macroeconomics, 43: 226-238.
- Europol, 2015-2017. EU Terrorism Situation and Trend Report (TE-SAT) 2015, 2016, 2017. The Hague.
- Europol, 2017. Europol Review 2016-2017. Retrieved from https://www.europol.europa.eu/annual_review/2016/ on March 9th, 2018.
- Fagerberg J., Srholec M., and Verspagen B., 2010. Innovation and economic development. In Handbook of the Economics of Innovation, Vol. 2. North-Holland: 833-872.
- Fincke B., and Greiner A., 2012. How to assess debt sustainability? Some theory and empirical evidence for selected euro area countries. Applied Economics, 44(28): 3717-3724.
- Forbes K.J., and Warnock F.E., 2012. Capital flow waves: Surges, stops, flight, and retrenchment. Journal of International Economics, 88(2): 235-251.
- Galenson W., and Leibenstein H., 1955. Investment criteria, productivity, and economic development. The Quarterly Journal of Economics, 69(3): 343-370.
- Haggard S., and Tiede L., 2011. The rule of law and economic growth: where are we?. World Development, 39(5): 673-685.
- Hakfoort J., 1996. Public capital, private sector productivity and economic growth: a macroeconomic perspective. In Infrastructure and the complexity of economic development. Berlin, Heidelberg: Springer, 61-72.
- Ignatov A., 2017. Liberalism-Key to Entrepreneurial and Innovation Success: Estonian Case Study. Romanian Economic Journal, 20(66).
- Jorgenson D.W.. 1991, January. Productivity and economic growth. In Fifty years of economic measurement: The Jubilee of the Conference on Research in Income and Wealth. Chicago: University of Chicago Press, 19-118.
- Kane T., Holmes K., O’Grady M.A., 2007. Economic freedom in five regions. Heritage Foundation (ed.).
- King R.G., and Levine R., 1994, June. Capital fundamentalism, economic development, and economic growth. In Carnegie-Rochester Conference Series on Public Policy, Vol. 40, North-Holland, 259-292.
- Knack S., and Keefer P., 1995. Institutions and economic performance: cross-country tests using alternative institutional measures. Economics & Politics, 7(3): 207-227.
- Lane P.R., 2012. The European sovereign debt crisis. Journal of Economic Perspectives, 26(3): 49-68.
- Liapis K., Rovolis A., Galanos C., and Thalassinos E., 2013. The Clusters of Economic Similarities between EU Countries: A View Under Recent Financial and Debt Crisis. European Research Studies, 16(1): 41.
- Liñán F., and Fernandez-Serrano J., 2014. National culture, entrepreneurship and economic development: different patterns across the European Union. Small Business Economics, 42(4): 685-701.
- Mankiw N.G., Romer D., and Weil D.N., 1992. A contribution to the empirics of economic growth. The Quarterly Journal of Economics, 107(2): 407-437.
- McKinnon R.I., 2010. Money and capital in economic development. Brookings Institution Press.
- Miller T., Kim A.B., 2017. Index of economic Freedom. Washington DC: The Heritage Foundation.
- Naudé W., 2010. Entrepreneurship, developing countries, and development economics: new approaches and insights. Small business economics, 34(1): 1.
- Nyström K., 2008. The institutions of economic freedom and entrepreneurship: evidence from panel data. Public Choice, 136(3-4): 269-282.
- OECD (2016). General government revenue Total, % of GDP, 2016. Retrieved from https://data.oecd.org/gga/general-government-revenue.htm on the 29th of January 2018.
- Ostry J.D., Ghosh A.R., Habermeier K.F., Laeven L., Chamon M., Qureshi M.S., and Kokenyne A., 2011. Managing Capital Inflows; What Tools to Use?. (No. 11/06). International Monetary Fund.
- Panizza U., and Presbitero A.F., 2013. Public debt and economic growth in advanced economies: A survey. Swiss Journal of Economics and Statistics, 149(2): 175-204.
- Parlemeter, 2017. European Parliament- Parlemeter 2017: Membership, Image and Role. p. 24. Retrieved from http://www.europarl.europa.eu on March 11th 2018.
- Piketty T., 2015. About capital in the twenty-first century. American Economic Review, 105(5): 48-53.
- Popkova E.G., and Tinyakova V.I., 2013. New quality of economic growth at the present stage of development of the world economy. World Applied Sciences Journal, 5(1): 617-622.
- Powelson J.P., 2015. The Institutions of Economic Growth: A Theory of Conflict Management in Developing Countries. Princeton: Princeton University Press.
- Reinhart C.M., and Rogoff K.S., 2010. Growth in a Time of Debt. American Economic Review, 100(2): 573-78.
- Robinson J., 2013. The accumulation of capital. Basingstoke: Palgrave Macmillan.
- Schwab K., and Porter M., 2007. The global competitiveness report 2006-2007. World Economic Forum.
- Schwab K., 2017. The global competitiveness report 2016-2017. World Economic Forum.
- Şener S., and Sarıdoğan E., 2011. The effects of science-technology-innovation on competitiveness and economic growth. Procedia-Social and Behavioral Sciences, 24: 815-828.
- Streeck W., 2014. The politics of public debt: Neoliberalism, capitalist development and the restructuring of the state. German Economic Review, 15(1): 143-165.
- The Guardian. 2018. Italian elections 2018 – full results. Retrieved from: www.theguardian.com on March 11, 2018.
- Timmer M.P., Inklaar R., O’Mahony M., and Van Ark B., 2011. Productivity and economic growth in Europe: A comparative industry perspective. International Productivity Monitor, (21): 3.
- Transparency International. Information available online at: https://www.transparency.org/research/cpi/overview. Retrieved on March 8th, 2018.
- Wennekers S., Van Stel A., Carree M., and Thurik R., 2010. The relationship between entrepreneurship and economic development: Is it U-shaped?. Foundations and Trends® in Entrepreneurship, 6(3): 167-237.
- World Bank, 2016. GDP (current US$). Information retrieved from https://data.worldbank.org/indicator/NY.GDP.MKTP.CD?locations=EU on March 8th, 2018.
- World Bank, 2017. Doing business 2017: Equal opportunity for all. Washington, DC: World Bank. https://doi.org/10.1596/978-1-4648-0948-4.
- World Bank, 2006. Doing business 2007: How to reform. Washington, DC: World Bank.
- World Bank. GDP (current US$). Available online at: https://data.worldbank.org, retrieved on March 11th, 2018.
- Young A., 2015. The single market from stagnation to renewal?. In Wallace H., Pollack M.A., Young A. Policy-making in the European Union. Oxford, USA: Oxford University Press, 115.
- Zelenika I., and Pearce J.M., 2011. Barriers to appropriate technology growth in sustainable development. Journal of Sustainable Development, 4(6): 12.
Annex 1 – Rankings of the EU countries based on business efficiency indicators
|
Economic Freedom rank |
Ease of doing |
Economic |
|||||||
|
2007 |
2017 |
Change |
2007 |
2017 |
Change |
2006 |
2017 |
Change |
|
|
AT |
25 |
30 |
-5 |
30 |
19 |
11 |
17 |
19 |
-2 |
|
BE |
17 |
49 |
-32 |
20 |
42 |
-22 |
20 |
17 |
3 |
|
BG |
62 |
47 |
15 |
54 |
39 |
15 |
72 |
50 |
22 |
|
HR |
109 |
95 |
14 |
124 |
43 |
81 |
51 |
74 |
-23 |
|
CY |
20 |
48 |
-28 |
– |
45 |
– |
46 |
83 |
-37 |
|
CZ |
31 |
28 |
3 |
52 |
27 |
25 |
29 |
31 |
-2 |
|
DK |
13 |
18 |
-5 |
7 |
3 |
4 |
4 |
12 |
-8 |
|
EE |
12 |
6 |
6 |
17 |
12 |
5 |
25 |
30 |
-5 |
|
FI |
16 |
24 |
-8 |
14 |
13 |
1 |
2 |
10 |
-8 |
|
FR |
45 |
72 |
-27 |
35 |
29 |
6 |
18 |
21 |
-3 |
|
DE |
19 |
26 |
-7 |
21 |
17 |
4 |
8 |
5 |
3 |
|
EL |
94 |
127 |
-33 |
109 |
61 |
48 |
47 |
86 |
-39 |
|
HU |
44 |
56 |
-12 |
66 |
41 |
25 |
41 |
69 |
-28 |
|
IE |
7 |
9 |
-2 |
10 |
18 |
-8 |
21 |
23 |
-2 |
|
IT |
60 |
79 |
-19 |
82 |
50 |
32 |
42 |
44 |
-2 |
|
LV |
41 |
20 |
21 |
24 |
14 |
10 |
36 |
49 |
-13 |
|
LT |
22 |
16 |
6 |
16 |
21 |
-5 |
40 |
35 |
5 |
|
LU |
8 |
14 |
-6 |
– |
59 |
– |
22 |
20 |
2 |
|
MT |
42 |
50 |
-8 |
– |
– |
– |
39 |
40 |
-1 |
|
PL |
87 |
45 |
42 |
75 |
24 |
51 |
48 |
36 |
12 |
|
PT |
43 |
77 |
-34 |
40 |
25 |
15 |
34 |
46 |
-12 |
|
RO |
67 |
39 |
28 |
49 |
36 |
13 |
68 |
62 |
6 |
|
SK |
40 |
57 |
-17 |
36 |
33 |
3 |
37 |
65 |
-28 |
|
SI |
58 |
97 |
-39 |
61 |
30 |
31 |
33 |
56 |
-23 |
|
ES |
27 |
69 |
-42 |
39 |
32 |
7 |
28 |
32 |
-4 |
|
SE |
21 |
19 |
2 |
13 |
9 |
4 |
3 |
6 |
-3 |
|
NL |
14 |
15 |
-1 |
22 |
28 |
-6 |
9 |
4 |
5 |
|
UK |
6 |
12 |
-6 |
6 |
7 |
-1 |
10 |
7 |
3 |
|
Countries ranked |
157 |
180 |
175 |
190 |
125 |
138 |
|||
|
Source: Kane et al. (2007), Miller & Kim (2017), World Bank (2006), Schwab (2007), Schwab (2017), World Bank (2017). |