Abstract
The article focuses on the identification of connection patterns between socioeconomic characteristics and respondents’ motivation. The research was performed on a sample of 202 shareholders of agricultural cooperatives in five Croatian counties. The correspondence analysis has confirmed the existence of high inertia within groups of economic and social motives as well as the highest importance for financial reasons. Multiple correspondence analysis identifies differences in response patterns of evaluating the influence of motivational factors. Better market placement is the main reason for joining cooperatives among respondents with full ownership rights having fewer than ten years of experience and lower income from agriculture. The respondents with higher income from farming or cooperation were more motivated to reduce production costs unlike the respondents with more moderate income.
DOI: 10.30682/nm1803g
Aleksandar Nedanov, Durdica Zutinic*
* University of Zagreb Faculty of Agriculture, Department of Agricultural Economics and Rural Development, Zagreb, Croatia.
Corresponding author: nedanov.aleksandar@gmail.com
1. Introduction
The theoretical assumption of cooperative ideology throughout history has been the significant driving force behind the foundation of cooperatives. The historical literature review contains balanced discussions of the importance of noneconomic reasons for entering into cooperatives and focuses on the significance of economic democracy and social cohesion, which should not be based on monetary incentives. In addition to pursuing financial goals, farmers’ began to cooperate among themselves because of the fear of social ostracism by the farmers’ who had already become members as well as for spiritual reasons. Kalmi (2007) reports that the literature from the beginning of the twentieth century contains more systematic analysis and precise details of cooperatives than the Anglo-American textbooks from the sixties that replaced the institutional approach with neoclassical economic analysis.
The lack of scientific ambition of organizational theorists has often been a contributing factor in shaping dismissive attitudes in the literature toward the pluralism of hybrid corporations (Williamson, 2000). Therefore, it is not surprising that comparisons between neoclassical firms and integrated organizations did not provide profound insights into the richness of various collective arrangements the prosperity of which on market economies is apparent worldwide (Ménard, 2014). The impact of internalization and globalization at the time led to the breakdown of solidarity among farmers, who became more receptive to economic initiatives such as lower production costs, lower business risk, and higher market prices for agricultural products. The traditional cooperative practice of nonprofit organizations and their ideological element formed on the basis of the quality of interpersonal relationships between members gradually became substituted by impersonal and market relations. In the world’s fastest-growing economies, ideology is no longer a reliable enough reason for farmers to join cooperatives, and more competitive markets imply that this decision must provide a foundation for an economic term (Karantininis and Zago, 2001). The modern economic theory of the cooperative firm has developed by three distinct schools of thought that view the collective as a form of vertical integration serving member farms, as a firm separate from member farms, or as a coalition (Valentinov and Iliopoulos, 2013). The first approach is founded on a principle of operation-at-cost where cooperatives are acting as a form of vertical integration and do not incur profits or losses for itself, so they are not studied as separate firms. Most empirical research follows the second approach, which optimizes the objective function of cooperatives so that they act as independent organizations and involve various forms of alienation from shareholders, such as members’ free-rider problem or opportunistic behavior by managers who are disinterested in serving the real needs of members. The application of game theory to the third prominent approach observes cooperatives as a coalition of shareholders with various interests and sheds considerable light on principal-agent conflicts, bargaining processes, non-negligible information costs, and maintaining the alliance. First attempts at game-theory modeling have been criticized for their unrealistic assumptions and the numerous calculations needed (Sexton, 1986); however, the conclusion of the decision to join the coalition lies in the economic benefits of cooperation persisting in empirical research (Karantininis and Zago, 2001). Mainstream neoclassical theory identifies property rights as private rights, treating them as transferable through markets and excluding them from an institutional environment, norms, and conventions and attributing trust to formal enforcing institutions. However, this is unreasonable because the existence of private, public, and collective types of property rights require different modalities of monitoring, modifying, and transferring them. It is fundamentally necessary to consider the different ways of organizing transactions carefully and assess the associated costs accordingly. Thus, Ménard (2014) proposed a simplified heuristics model to enrich the existence of various collective arrangements such as cooperatives and the bargaining process among them. However, the internal characteristics of these agreements are still unknown and need further study, especially with regard to coexistence in similar transactions.
Agricultural cooperatives have a significant role in ensuring food security and sustainable development in rural areas. They provide real economic benefits by enhancing production stability, enabling a market approach to products and services, and obtaining a strong position in the value chain, thus, contributing to the increase in the local development and the life standard in rural communities (Wanyama, 2014). The background behind motivational factors includes overcoming the obstacles that they encounter with production and business activities and capitalizing on new market opportunities. Empirical research has revealed the primary reasons and benefits in joining a cooperative as follows: easier access to the market and to the creation of a market with added value, reduced sales-related risks, more significant production, and more income productivity. Additionally, other benefits are lower costs of input and marketing, higher product prices, greater possibilities for accessing new technologies, information, and knowledge, and greater ability to help themselves and to contribute to local community development, which exemplifies member interests in the best way (Krivokapic-Skoko, 2002; Mazzarol, 2009). Sultan and Larsén (2011) conclude that the primary motivation of farmers is economic related, much more than social reasons, such as communication or better work environment, least of all, government and institutional support. Majority of farmers see the advantages of joining in the opportunity to reduce production and sale costs, to raise and stabilize the retail price, to get better product promotion and to meet technical knowledge and services (Pan, 2011).
On the contrary, it is a very unknown how trust or other social capital indicators affect farmers’ willingness to cooperate, what types of social signs are the most important, or under what conditions they may matter. Scholars agree that trust has been a crucial component in the success of traditional cooperatives (Hansen et al., 2002), while the concepts of loyalty and member commitment have been essential ingredients in the cooperative context, and they continue to be important in the present time (Fulton and Adomowicz, 1993; Österberg et al., 2009; Hakelius and Hansson, 2016a). Stallman and James’s (2016) logistic regression model explores different conceptualizations of trust that influence on a farmer’s willingness to take part. Social science literature is full of support for the hypothesis that belief lubricates cooperation between shareholders who more often join voluntary associations (Putnam, 1993). But, empirical analyses present a more cautious view because the results support very little evidence of trust as an essential determinant that influences farmers’ willingness to cooperate.
In an attempt to test the psychological and psychometric theory of behavioral frameworks, Hakelius and Hansson (2016b) measured changes in farmers’ attitudes towards cooperatives during the eleven years. Their results have shown that time has not influenced the coverage of the attitudes in a model with two-dimensional measuring constructs. However, policy implications had been a significant driver in increasing the strength evaluations of both the attitude dimensions of shareholders’ commitment to and trust in the cooperative. The majority of available literature uses regression models to analyze the effect of particular demographic and socioeconomic characteristics of farms that join cooperatives (Wadsworth, 1991; Cooley and Lass, 1998; Bavorová and Curtiss, 2006; Leathers, 2006; Golovina and Nilsson, 2009; Sayadi et al., 2011; Othman et al., 2012). Karli et al. (2006), who performed a study about a binary probabilistic model, explored the farmers’ socioeconomic features that affected the decision to join cooperatives in the Anatolian region; meanwhile, Nugusse et al. (2013) used the binary choice model to investigate the factors that motivate rural people to join cooperative societies in Northern Ethiopia.
2. An overview of the Croatian cooperative movement
Until recently, a cooperative sector in Croatia has been affected at the same time by systematic privatization process of remaining cooperatives from ex Yugoslavia and with a rapid increase in many pseudo organizations who did not adhere to international cooperative practices. The first Law on cooperatives (Official Gazette (OG), 36/1995) and its Amendments (OG, 12/2002) had a responsibility to preserve essential features that distinguish them from other business entities and to establish a foundation of an umbrella meso-institution, whose objective as an intermediary is to provide transmission mechanisms between cooperatives and government institutions. With last and affirmative legal frameworks (OG, 34/2011, 125/2013, 76/2014), the cooperative sector in Croatia has finally stepped inside the second stage of collective life cycle and organizational design by setting up joint aims regarding the most various interests (Cook and Burres, 2009). However, the cooperative legislation still contains several relevant articles that we will explain in the concluding remarks.
Over the last two decades, a cooperative sector in Croatia has witnessed a significant decline in all socioeconomic indicators whose numerical values are considerably below the EU-27 average (Nedanov and Žutinić, 2015). In 2016, only 0.55% of the total population has been registered as a shareholder, while an overall cooperative sector is gathering 1.43% of the active working population and gaining over 0.5% share of GDP. The overall cooperative sector in Croatia consists of 1,218 cooperatives who are gathering 20,483 shareholders, employing 2,595 workers and had realized total income of almost 220 million EUR. Cooperatives in the agro-food sector are the most substantial and most contributing to the total revenue of the overall cooperative sector (78%) in which agricultural cooperatives have the most significant shares (52%), followed by the agro-processing (18%) and fishing organizations (8%). At the sectoral level, cooperatives are most dominant in agriculture, where 495 organizations (41%) operate with 7,580 shareholders (37%) and 1,208 employees (47%). Inside the cooperative sector, their income amounted to 52% of the total revenue and more than 5% at the national level in the last fiscal year. However, the fisheries sector is the most efficient part of the agro-food industry, in which 39 fishermen’s cooperatives have more than twice as many revenues on average (473,631.25 EUR) in comparison to agricultural (228,781.40 EUR) and processing organizations (191,155.00 EUR).
In Croatia, systematic socioeconomic research on cooperatives has not been peformed over a considerable period, and there is no knowledge about the economic and social impacts on the agricultural and other cooperative sectors (Petak, 2005). We should mention a sociological study by Kovačić et al. (2001) on the farmers’ willingness to cooperate when the educational level and the psychological features of innovativeness and entrepreneurship bear significant impact on their option to join or organize a cooperative. The research performed by Žutinić et al. (2015) shows that the majority of young farmers in Croatia still have the initiative to network and to build the relationship with other producers, despite the unfavorable institutional and financial environment for the corporate sector.
The primary aim of this paper is to explore one’s reasons for joining agricultural cooperatives. Using the correspondence analysis (CA) and the multiple correspondence analysis (MCA), this article focuses on the research of connected patterns of motivational factors to identify mutual relationships between the motives and the socioeconomic characteristics of the members. The secondary aim is to contribute to further scientific dialogue on the dual nature of cooperative organizations and the economic theory of cooperatives, which can additionally inform the theory of modern nonprofit economics. The research paper offers a forgotten approach to the various analyses of the cooperative sector, and the unification with the commonly used methods will bring a comprehensive understanding of collective entrepreneurship. The application of non-standardized methods, such as CA and MCA analysis, will contribute to the popularization of cooperative research and holistic practices that, apart from the descriptive nature, can predict many forms of correlation between different groups of variables. Using these methodological approaches allowed us not only an examination of what incentives sustain members’ participation in cooperatives but also a study or comparative analysis of economic fluctuation, social contribution to resilient employment and sustainable economy within the cooperative sector or national economy over time. Their applying is of particular importance if we consider the incomplete national statistics and incomparable databases that contribute to the unenviable position of the cooperatives in the scientific literature and to the impossibility of performing the inferential statistics that would enable better measurement and comparison. The paper prolongs the discourse of modern cooperative theory that dominates neoclassical economic analysis and small extent case studies.
3. Materials and methods
The paper presents the data collected in more comprehensive field research on agricultural cooperatives as a competitive entrepreneurial form (Nedanov, 2015). In five counties in the eastern part of continental Croatia, we performed the study among shareholders of agricultural cooperatives. In a sample of 202 participants, we used a written survey for data collection. The present analysis includes answers to questions about the motives for entering a cooperative and a set of questions about socioeconomic characteristics: professional status, i.e., membership type; engagement in agricultural production; participation in the corporate foundation; income from farming and cooperation. Measurement of motivational factors included ten items, which the respondents rated on a five-degree scale (5- – extremally important to 1 – entirely unimportant reason).
We first performed data processing on the level of descriptive statistical analysis. The reasons for entering a cooperative were listed by importance degree and divided into two groups of economic and social motives. To determine the connection pattern between incentives and socioeconomic features, CA and MCA were carried out using FactoMineR (Lê et al., 2008) and ggplot2 package (Wickham, 2011) within R Studio software-version 1.0.136.
4. Results and discussion
4.1. Descriptive analysis of respondents’ socioeconomic characteristics and motivators
Table 1 provides descriptive data on the socioeconomic features of respondents submitted to analysis.
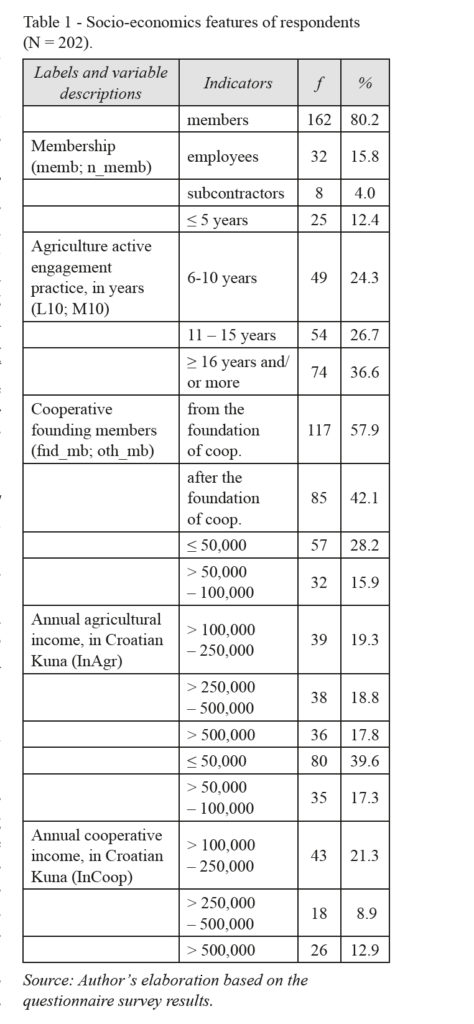
Table 2 shows the distribution of respondents’ answers regarding the degree of a particular motive’s importance for joining a cooperative as well as their respective arithmetic means (Xi) and coefficients of variation (CVi). The respondents on average rated all the mentioned motives as being relatively crucial for joining a cooperative (from moderately to extremely important). The second motive, “safer product placement and market sales” (x2 = 4.02), represents the highest relative importance while the least important motive for joining a cooperative was motive 4, “easier access to government support and grants through cooperatives” (x4 = 2.65). In the group of social motives, the most important was “acquiring professional and social skills” (x6 = 3.42), and the least important one was “meeting new people” (x8 = 2.72).
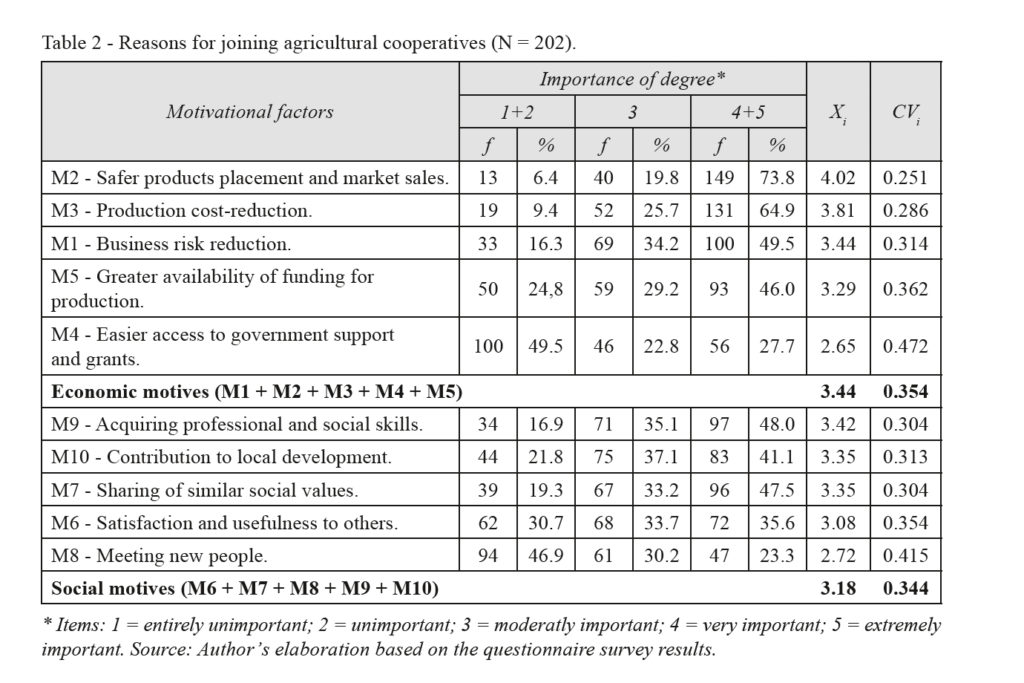
As a whole, the group of economic motives shows a relatively higher average value (xE = 3.40) than the set of social purposes (xS = 3.20), which can lead to the conclusion that upon entering into cooperation, farmers were primarily motivated by economic reasons.
4.2. Correspondence analysis of motivational factors
For a better examination of a relationship between motivational factors and the pattern rating scale, a contingency table with 10 rows and five columns is created (see Table 3). To identify whether ratings scaled are evenly distributed among motivational factors, if a pattern of association exists in members’ motivational elements, or if the rating scale of their importance CA is performed.
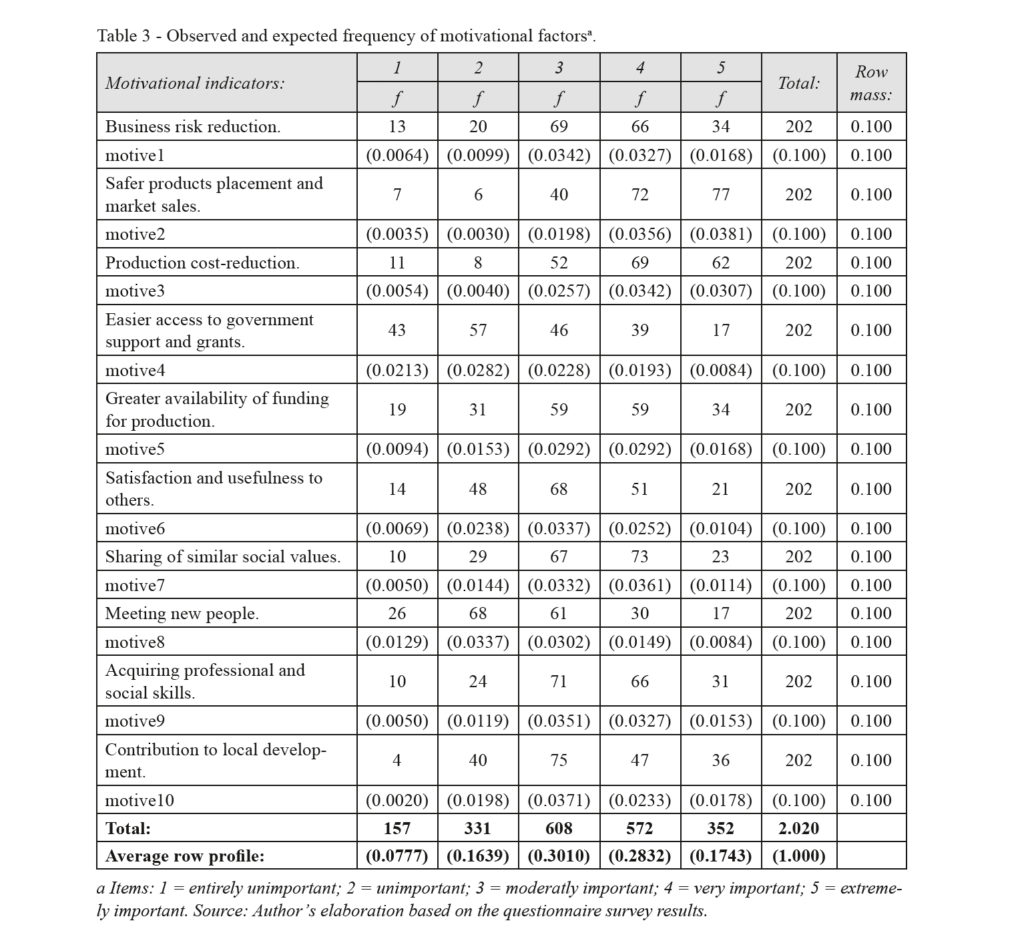
The chi-square statistics confirmed the significant dependence between rows and columns of the contingency table (χ²(36) = 340.099; p < 0.001). The Pearson’s phi coefficient indicates a moderate canonical correlation between the row and column variables (Φ2 = 0.410). The same value and behavior have the contingency coefficient C = 0.380, while Cramer’s V coefficient shows a weak association between the variables (20.5%).
The interpretation of the CA results comprises a simultaneous analysis of the numerical results and graphical visualization. In the reduction of dimensionality, we apply the scree plot method that has been found to perform reasonably well (Hoffman and Franke, 1986; Alberti, 2013). The maximum number of approximate dimensions that can be estimated is one less than the smaller of the number of rows or columns. In comparing the additional variance concerning the increased complexity in interpreting the results, a two-dimensional solution was deemed adequate for further analysis. Dimensions 1 and 2 together are sufficient to retain 92.21% of the total variance contained in the data, which amounts to φ2 = 0.168. The singular values of extracted dimensions indicate a value of 0.355 for the first axis that explains 75.01% of the variance in the cumulative solution. The second singular value is 0.170 and represents only 17.20% of the difference. Furthermore, the third axis has a proportion of inertia equal to 6.95%, and the last dimension explains less than 1% of total variance (0.84%).
For a complete interpretation of the data visualization, we additionally used numerical results (Table 4). Table contents provide more details to understand the actual decomposition of the variance based on individual contributions to row and column points. In the fifth and eighth columns are coordinate values of each motivational factor and rating scale items across both dimensions. To correctly interpret the numerical results, it is necessary to take account of both absolute (column 7 and 10) and relative contributions (column 6 and 9). In the second column titled ‘quality’ is the cumulative total of variances explained by each row and column along two dimensions. The masses in column three enable us to weigh row and column profiles point in proportion to its frequency. The higher values of squared cosines indicate greater explanation of points’ inertia and how well each point is fit, while the angle and direction of the profile vector regarding principal axes described how profile points correlate highly with axes.
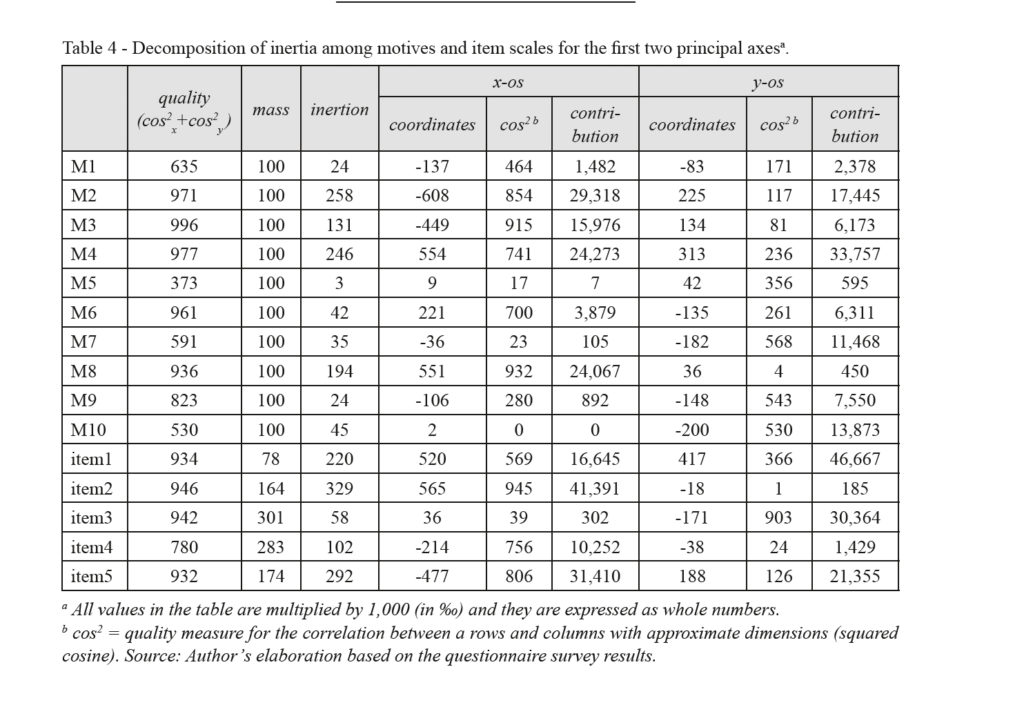
Data shows that the motivational factors and rating scales do not have an equal relative and absolute contribution in the explanation of the total inertias of given dimensions. As a general guideline for deciding which contributions are large and which are small, we use the average as a threshold (Bendixen, 1995; Greenacre, 2007). In the case of motives, we regard rows with contribution higher than 10% as significant contributors while five rating scale items give us an average of 20%.
The motive attributes with a significant percentage in explaining the total inertia of the x-axis are “safer products placement and market sales” (29.32%), “easier access to government support and grants” (24.27%), “meeting new people” (24.07%) and “production cost–reduction” (15.98%). The remaining motives do not bear significant value in the description of the first dimension. Furthermore, these motives retrieve the best information on the x-axis as their inertias are respectively 0.043, 0.041, 0.033 and 0.022. Their strong absolute contributions attest to vital links with other modalities of the variables. A lower distribution of motivational factors and their grouping on the negative pole characterize the second dimension. The highest percentage of explaining the second dimension also pertains to the economic motives “easier access to government support and grants” (33.76%) and “safer products placement and market sales” (17.44%). The two social motives of “sharing of similar social values” (13.87%) and “contribution to local development” (11.47%) explain this dimension with a lower contribution. Despite lower total contribution to their projection on the principal axes, motives of “business risk reduction”, “satisfaction and usefulness”, “acquiring professional and social skills” still have a good quality of representation, and we include them in the interpretation. However, the weak relative contribution of “greater availability of funding” indicates undifferentiated profile distortion and a high loss of data information in their presentation on principal axes. So because they lie more along the third and fourth axes than along the first two, its rows profile is not accurately represented. We can exclude them from the further analysis and an interpretation of the results though it had explained less than 50% of the variance (cos2x+y = 0.373). It is also possible to define two dimensions with the rating scale items of importance to join cooperatives. Thus, the ratings of unimportant (41.39%) and extremely important reason (31.40%) significantly contribute to explaining the first dimension, and entirely irrelevant (46.67%), moderately (30.36%), and extremely important cause reason (21.35%) to the second approximate aspect. Likewise, all five rating scale items have a high relative contribution to a presentation on principal axes.
In Figure 1 is depicted the numerical representation of the CA results from Table 4. Notice those general physical concepts of distance, length, and angle have great importance in an interpretation of graphical exhibit. Distance is a value quantifying the closeness of motivational factors to relevant rating scale items, and an angle is a value quantifying how rapidly two vectors are moving apart and diverging from a common centroid.
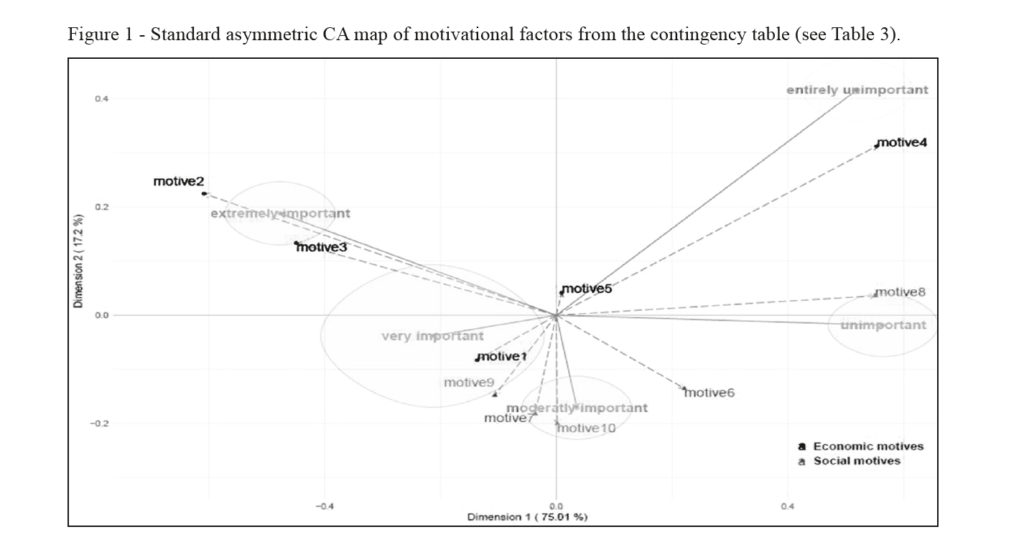
From the graphical exhibit, it is apparent that the most critical motives are positioned in the upper part and left side of the perceptual map. They are primarily economic and show strong correspondence with fundamental reasons for entering a cooperative. These are the economic motives of safe product placement (M2) and production cost-reduction (M3). The least essential reasons for entering cooperatives, such as meeting new people (M8) and easier access to government support and grants (M4), are associated with the positive pole of the x-axis. The differences of angle measures between suitable vectors indicate that the motive of safer product placement and market sales (M2) is more important than the motive of production cost-reduction (M3) and easier access to government support and grants through cooperatives (M4). Moreover, a relevant motive is less important than the purpose of meeting new people (M8). The groups of causes mentioned above have been confirmed the most considerable approximative distances and we can thus conclude that the importance of individual motives grows towards the left side of the asymmetrical map. Between these opposition groups and on the left side of the map are located the business risk reduction (M1) and acquiring professional and social skills (M9) which are considered by members to be fundamental reasons for joining cooperatives. Near them, respectively located from the left side to the right side of the asymmetrical map, importance of sharing similar social values (M7), active participation in local community development (M10), and feeling of satisfaction and usefulness (M6) correspond with a moderately important rating scale item. The motive of greater access to government support and grants through cooperatives (M5) near the centroid show very similar inertia with the average profile.
4.3. Mutual relationships between members’ motives and socioeconomic features
To draw a clear picture of relationship patterns between motivational factors (Table 2) and relevant socioeconomic features of the respondent’s study (Table 1), we adopted the technique of MCA to reduce the dimensionality into a meaningful representation. We applied MCA to the Burt matrix, which is a result of two-way cross-tabulations amongst the set of analyzed categorical variables. The Burt matrix is a square, symmetrical block matrix in which the diagonal block partitions contain the marginal frequencies of each variable while the rectangular block off-diagonal barriers are two-way contingency tables for the corresponding pairs of variables.
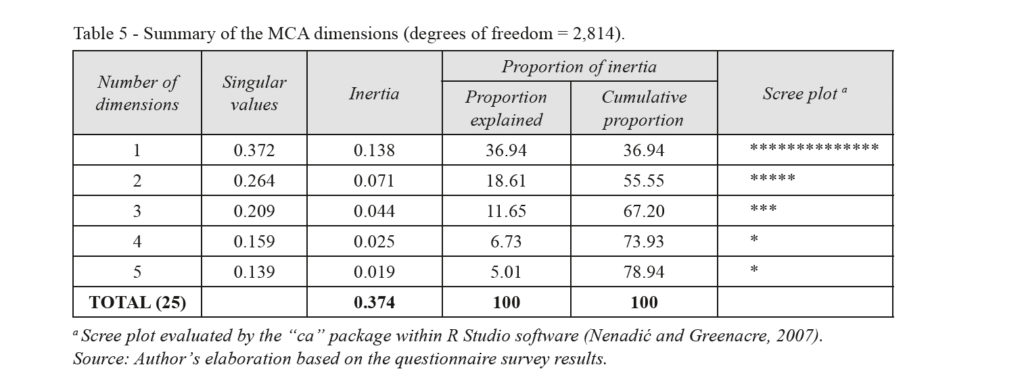
In our research, the Burt matrix is a 15×15 block matrix with 225 partitions overall and only 15 unique diagonal partitions with cross-tabulations of each variable with itself. Table 5 presents the inertia and singular value decomposition for the first five dimensions’ of MCA. The singular values greater than 0.2 suggest that the first three dimensions are necessary to retain the explanation of the importance of motivational factors (Hair at al., 1995). The first three dimensions together explain 67.20% of total inertia as their eigenvalues are 0.372, 0.264, and 0.209, respectively. Analogous to the Kaiser-Guttman criterion of unity for the eigenvalues in PCA, the values that satisfy the inequality ≥1/number of dynamic variables represent the average inertia per dimension, serving as a threshold for deciding which axes are worth interpreting (Greenacre, 2007; Di Franco, 2016). Consequently, the third dimensions exceed the average threshold and contribute significantly to the explanation of total inertia (average inertia explained per dimension is equal to 0.067). Finally, the inspection of the scree plot and eigenvalues confirmed the importance of the first two dimensions of data analytics. We may consider a higher number of aspects, but the additional coordinate axes are unlikely to contribute significantly to the interpretation of nature of the dependency between the profile rows and columns. However, the percentages of inertia explained by remaining dimensions are low and tend to be close to each other, which might lead to an assumption that individual axes might be unstable.
The scaling factor indicates the existence of an even more apparent canonical correlation between the profiles of rows and columns (FS = 0.569). The total data inertia in the Burt matrix amounts to φ2 = 0.324. In Figure 2 is a perceptual map of MCA. It is important to note that this two-dimensional exhibit is a part of the three-dimensional solution. For complete insight into the results of MCA, see Figure 3 and Figure 4 in the Appendix. Because of limitations of space and to provide both visual clarity and analytical rigor in displaying observed categorical variables, an initial five modalities for the motivational factors are condensed to three, and socioeconomic features to two modalities (Figure 2). From the perceptual map, we can observe a connection pattern between the respondents’ motives and socioeconomic elements.
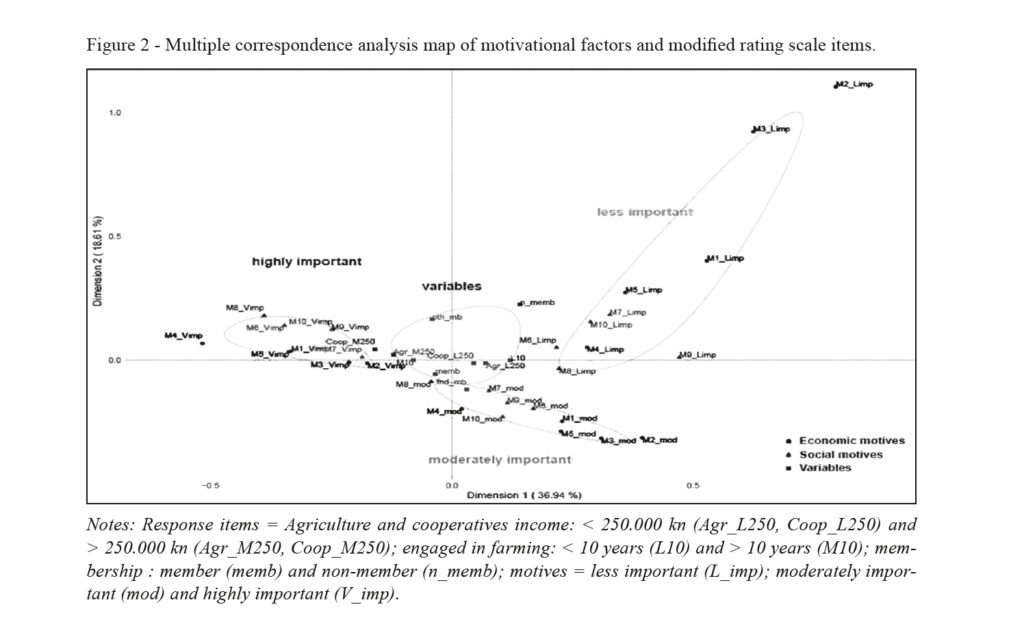 If we consider categories of socioeconomic features, the further we go to the left side of the map the more motivational factors have an average rating of “highly important.” The opposite is also valid since respondents determined by socioeconomic features on the right side of the graph typically rate motives as less or moderately important. Moreover, the positioning of socioeconomic response categories in the upper part of the map reflects respondents’ attitudes towards less important reasons; i.e., placement of socioeconomic response categories in the lower part of map reflects respondents’ attitudes towards moderately essential reasons for joining cooperatives.
Respondents earning an income higher than 250.000 HRK through farming (Agr_M250) and cooperation (Coop_M250) averagely rate all of the motivational factors with more top-rating categories compared to the respondents earning less than 250.000 HRK. Economic motives for safer product placement and market sale (M2), production cost-reduction (M3), and social motivations of sharing social values (M7) and acquiring professional and social skills (M9) represent highly essential reasons for entering cooperatives among respondents earning a higher income. However, they attribute different value to the importance of easier access to government support and grants through organizations (M4) and meeting new people (M8). Respectively, respondents with lower financial earnings averagely rate all motivational factors as moderately important. With the economic motives of safer product placement and market sales (M2), production cost-reduction (M3), higher availability of government funding for agricultural production (M5), and business risk reduction (M1), differences in their attitude are most pronounced. A graphical exhibit of dimension 2 and 3 shows that respondents with higher income from agriculture and cooperation considered social motives of contribution to local development (M10), satisfaction and usefulness (M6), in average, as less critical reasons for entering cooperatives, while among the respondents with lesser income the motive of sharing similar social values (M7) is considered as a fundamental reason for joining organizations (see Figure 3 and Figure 4 in the Appendix).
In the aspect of respondents’ duration of professional engagement in agricultural production, the same rating pattern of motivator importance is present. On average, those with more than ten years’ experience in agricultural production (active_M10) rated all motives as highly relevant, compared to the respondents with less experience (active_L10). While the more experienced farmers agree that economic incentives (M2 and M3) constitute particularly essential reasons for entering cooperatives, less experienced ones would not agree on their importance. On the other hand, farmers that are longer in the business tend to rate social motives (M4 and M8) differently, while less experienced farmers agree on their lesser importance and influence on entering into a cooperative enterprise. The other two perceptual maps of significance dimensions confirm that experienced farmers, on average, have similar attitudes to all five economic motives as a highly important. Also, they consider the social motivation of acquiring professional and social skills (M9) as a less important reason for entering cooperatives (see Figure 3 and Figure 4 in the Appendix). Furthermore, the farmers with less experience agree about the high importance of sharing similar social values for entering agricultural cooperatives (M7).
Full members of cooperatives (memb) averagely rate all motivational factors as highly or moderately essential reasons compared to employees and subcontractors (n_memb). For them, social motives of satisfaction and usefulness (M6), meeting new people (M8), and contributing to local development (M10) rate as less important reasons for joining an agricultural cooperative. Furthermore, these respondents have a similar attitude to the extreme importance of the two economic motives (M2 and M3) and the moderate importance of the two social causes (M8 and M7). On average, founding members (fnd_mb) rate all of the motivational factors as reasonable compared to joined members (oth_mb). They report being primarily led by economic motives of safer product placement and market sales (M2) and production cost-reduction (M3), which they rate as highly significant. Perceptual map of second and third dimensions confirmed the moderate importance of all motives among the full members and members of the founding assembly. Compared to them, external associates and joined members are more divided in their attitudes to the favored reasons for entering cooperatives (see Figure 3 and Figure 4 in the Appendix).
Finally, the results of the analysis primarily recognized agricultural cooperatives as a competitive form of entrepreneurship where social interests without direct material benefits for members do not have higher significance when entering agrarian organisations in comparison with economic reasons. Economic motives are galvanizing respondents to come forward to participate in agrarian organizations while shared goals, values, and sense of community deadened membership participation. The dominance of financial causes justifies the results of the previous field research about the attitudes and willingness of farmers to cooperate.
5. Conclusions
Unlike most of the EU countries where cooperatives significantly contribute to the development of agriculture and rural areas, in Croatia they do not recognize their full potential as a possible business model for the economic strengthening of the small and fragmented agricultural structure.
Some legal barriers that contributed to the slowdown of cooperative growth during the transition period still have a persistent need for appropriate modifications. One of them concerns an ownership issue regarding the total assets that, according to the actual law, are becoming the property of local self-government after the liquidation of the cooperatives. Although this successfully stops the criminal dissolution process of collective ownership, on the other hand, it is a severe risk for investment, which slows economic progress. The double taxation issue is another relevant problem connected with the previous one, in which members, by deciding not to invest back into the corporate business, become once more the subject of taxing dividends in addition to taxing corporations. By giving tax relief to cooperatives who decided to report long-term forms of assets in financial statements, the negative attitude of the investors will be weakened, and their complete integration into the market will be facilitated. Furthermore, it is essential to complete a national strategy to establish a third sector in the national accounts system separately so as to obtain consistent and reliable data for the comparison and recognition of cooperatives in the federal corporate jurisdiction. The implementation of a flexible regulatory regime with a corporate tax policy and corporate auditing governance will incentivize their production and ensure that a cooperative society will practice its activities appropriately.
Such an institutional arrangement can encourage next stage of business networking among cooperatives under principles of clustering that improve market competitiveness and enable the preservation of origins and customs. Further development should also consider the inclusion of organizations in a local action group which represent horizontal links between various economic activities in rural areas. The simultaneous composition of horizontal and vertical integration can ensure the potential for a higher level of development that can stem regional strategies, balance environmental quality, and support stakeholder networking. In addition, the development of a trademark and promotional logo supplement (coop) will preserve the tradition, authenticity, and origin of cooperative products, and provide a more apparent comparative advantage to the Croatian cooperatives in the domestic and EU markets.
However, these favorable structural and procedural contrivances in institutional design are not enough for encouraging the dynamic development of the cooperative sector. It is evident that embedded socioeconomic and sociocultural factors will have to play an indicative role in the further active development of a collaborative society (Putnam, 1993). That applies in particular to issues of bonding social capital and overcoming the absence of trust in cooperatives as reliable agents of economic democracy. It is crucial to emphasize that poor credential and opportunistic behavior towards organizations are still rooted in the mental maps of majority Croatian public. According to Williamson (2000) and Ménard (2014) impact of ideology, beliefs and religion can play a large role in the integrity of transmission mechanism and social embeddedness degree of the cooperative practice in Croatian society.
Acknowledgements
This research work was part of the scientific project “The co-operative organization-competitiveness of family agriculture” (178-1782223-2216).
References
Alberti G., 2013. An R script to facilitate correspondence analysis. A guide to the use and the interpretation of results from an archaeological perspective. Archeologia e Calcolatori, 24: 25-53.
Bavorová M. and Curtiss J., 2006. What motivates farms to associate? The case of two competing Czech agricultural associations. International Association of Agricultural Economists Conference, Queensland.
Bendixen M.T., 1995. Composing perceptual mapping using chi-squared trees and correspondence analysis. Journal of Marketing Research, 11(6): 571-581.
Cook M.L. and Burres M.J., 2009. A Cooperative Life Cycle Framework. International workshop Rural Cooperation in the 21st century: Lessons from the Past, Pathways to the Future, Rehovot.
Cooley J.P. and Lass D., 1998. Consumer Benefits from Community Supported Agriculture Membership. Review of Agricultural Economics, 20(1): 227-237.
Di Franco G., 2016. Multiple correspondence analysis: one only or several techniques?. Quality & Quantity International Journal of Methodology, 50(3): 1299-1315.
Fulton J.R. and Adomowicz W.L., 1993. Factors That Influence the Commitment of Members to Their Cooperative Organization. Journal of Agricultural Cooperation, 8: 39-53.
Golovina S. and Nilsson J., 2009. Difficulties for the Development of Agricultural Cooperatives in Russia: The Case of the Kurgan Region. Journal of Rural Cooperation, 37(1): 52-71.
Greenacre M., 2007. Correspondence Analysis in Practice. Boca Raton: Chapman & Hall/CRC, Taylor & Francis Group.
Hair J.F., Black W.C. Babin B.J. and Anderson R.E., 1995. Multivariate Data Analysis. 7th ed. Upper Saddle River, N.J.: Prentice Hall.
Hakelius K. and Hansson H., 2016a. Members’ attitudes towards cooperatives and their perception of agency problems. International Food and Agribusiness Management Review, 19(4): 23-36.
Hakelius K. and Hansson H., 2016b. Measuring Changes in Farmers’ Attitudes to Agricultural Cooperatives: Evidence from Swedish Agriculture 1993-2013. Agribusiness, 32(4): 531-546.
Hansen M.H., Morrow J.L. and Batista J.C., 2002. The impact of trust on cooperative membership retention, performance, and satisfaction: an exploratory study. International Food and Agribusiness Management Review, 5(1): 41-59.
Hoffman D.L. and Franke G.R., 1986. Correspondence Analysis: Graphical Representation of Categorical Data in Marketing Research. Journal of Marketing Research, 23(3): 213-227.
Kalmi P., 2007. The Disappearance of Cooperatives from Economics Textbooks. Cambridge Journal of Economics, 31(4): 625-647.
Karantininis K. and Zago A., 2001. Endogenous membership in mixed duopsonies. American Journal of Agricultural Economics, 83(5): 1266-1272.
Karli B., Bilgiç A. and çelik Y., 2006. Factors Affecting Farmers’ Decision to Enter Agricultural Cooperatives Using Random Utility Model in the South Eastern Anatolian Region of Turkey. Journal of Agriculture and Rural Development in the Tropics and Subtropics, 107(2): 115-127.
Kovačić D., Juračak J. and Žutinić Đ. 2001. Willingness of farmers to cooperate-Field study results in the Zagreb rural area. Društvena istraživanja, 10(6): 1119-1129.
Krivokapic-Skoko B., 2002. The Concept and Classifications of Agricultural Co–operatives, Bathurst, N.S.W: Australian Centre for Co-operative Research & Development.
Lê S., Josse J. and Husson F., 2008. FactoMineR: An R Package for Multivariate Analysis. Journal of Statistical Software, 25(1): 1-18.
Leathers H.D., 2006. Are Cooperatives Efficient When Membership Is Voluntary?. Journal of Agricultural and Resource Economics, 31(3): 667-676.
Mazzarol T., 2009. Cooperative Enterprise: A Discussion Paper and Literature Review. Available on http://www.cemi.com.au/node/219. Accessed 14.11.2017.
Ménard C., 2014. Embedding organizational arrangements: towards a general model. Journal of Institutional Economics, 10(4): 567-589.
Nedanov A., 2015. Attitudes and opinions of stakeholders towards cooperatives as a competitive form of entrepreneurship/Stavovi i mišljenja članova o zadrugama kao konkurentnom obliku poduzetništva. Field research project, Faculty of Agriculture University of Zagreb.
Nedanov A. and Žutinić Đ., 2015. Cooperative organization as a factor of competitiveness and sustainability in Croatian Agriculture. Agriculture and Forestry, 61(1): 113-120.
Nenadić O. and Greenacre M., 2007. Correspondence Analysis in R, with Two- and Three-dimensional Graphics: The ca Package. Journal of Statistical Software, 20(3): 1-13.
Nugusse W.Z., van Huylenbroeck G. and Buysse J., 2013. Determinants of rural people to join cooperatives in Northern Ethiopia. International Journal of Social Economics, 40(12): 1094-1107.
Österberg P., Hakelius K. and Nilsson J., 2009. Members’ Perception of their Participation in the Governance of Cooperatives: The Key to Trust and Commitment in Agricultural. Agribusiness, 25(2): 181-197.
Othman A., Kari F., Jani R. and Hamdan R., 2012. Factors Influencing Cooperative Membership and Share Increment: An Application of the Logistic Regression Analysis in the Malaysian Cooperatives. World Review of Business Research, 2(5): 24-35.
Pan L., 2011. Willingness of Farmers Joining Professional Cooperatives-Based on the Questionnaire Survey of Nanjing. Asian Agricultural Research, 3(3): 109-112.
Petak A., 2005. Challenges to Agricultural Economy-Croatian Case/Izazovi poljoprivrednog gospodarstva-izazovi Hrvatske. Sociology and Space, 43(167): 5-16.
Putnam R.D., 1993. Making democracy work: Civic traditions in modern Italy, Princeton, N.J: Princeton University Press.
Sayadi S., Calatrava J. and Ruiz F.A., 2011. Factors related to joining cooperatives for milk marketing among Spanish goat breeders. In: Bernués A., Boutonnet J.P., Casasús I., Chentouf M., Gabiña D., Joy M., López-Francos A., Morand-Fehr P. and Pacheco F. (eds). Economic, social and environmental sustainability in sheep and goat production systems. Zaragoza: CIHEAM/FAO/CITA-DGA: 277-282.
Sexton R.J., 1986. The Formation of Cooperatives: A Game-Theoretic Approach with Implications for Cooperative Finance, Decision Making, and Stability. American Journal of Agricultural Economics, 68(2): 214-225.
Stallman H.R. and James H.S., 2016. Farmers’ Willingness to Cooperate in Ecosystem Service Provision: Does Trust Matter?. Annals of Public and Cooperative Economics, 88(1): 5-31.
Sultan T. and Larsén K., 2011. Do Institutional incentives matter for farmers to join cooperatives: A Comparison of two Chinese regions. Journal of Rural Cooperation, 39(1): 1-18.
Valentinov V. and Iliopoulos C., 2013. Economic Theories of Nonprofits and Agricultural Cooperatives Compared. Nonprofit and Voluntary Sector Quarterly, 42(1): 109-126.
Wanyama F.O., 2014. Cooperatives and the sustainable development goals: A contribution to the post-2015 development debate. Geneva: International Labour Organization.
Wickham H., 2011. ggplot2. Wiley Interdisciplinary Reviews: Computational Statistics, 3(2): 180-185.
Williamson O.E., 2000. The New Institutional Economics: Taking Stock, Looking Ahead. Journal of Economic Literature, 38(3): 595-613.
Žutinić Đ., Hadelan L., Tomić M. and Nedanov A., 2015. Young Farmer’s attitudes towards the business cooperation. In: Kovačević D. (ed). Book of proceedings Sixth International Scientific Agricultural Symposium Agrosym. Jahorina, University of East Sarajevo, Faculty of Agriculture: 1868-1873.