Abstract
This study aims to fill the gap in the literature that has characterized the previous studies whose focus had always been on food insecurity assessment and evaluations with few studies on the underline factors that predispose households into being food insecure in form of risks which this study investigated. The study was designed to serve as veritable tool in designing food programs to proffer long-term remedies to growing food insecurity by addressing its underline causes which are the risks in various forms depending on the households and locations. Primary data collected with the aid of structured questionnaires from a total of 161 households selected by multistage random sampling technique were used. The findings showed that majority of the households representing 87 percent manifested various forms of food insecurity risks with food price hikes topping by 95 percent casting aspersion on the achievement of zero hunger target in Nigeria. The results of logistic analysis showed that five of the explanatory variables significantly influenced the presence or otherwise of food insecurity risks in the households at various levels. There was positive correlation between food insecurity risks and management strategies adopted by households.
Wasiu O. Fawole*, Burhan Ozkan**
* Department of Agricultural Economics and Extension, Faculty of Agricultural Sciences, National Open University of Nigeria (NOUN), Kaduna, Nigeria.
** Department of Agricultural Economics, Akdeniz University, Faculty of Agriculture, Antalya, Turkey.
Corresponding author: bozkan@akdeniz.edu.tr.
DOI: 10.30682/nm1802c
1. Introduction
Food security has been variously defined as a multidimensional concept because of its importance to human survival the latest of which as «a situation that exists when all people, at all times, have physical, social and economic access to sufficient, safe and nutritious food that meets their dietary needs and food preferences for an active and healthy life» (FAO, 2002). Consequently, food insecurity refers to the opposite of the above definition which can be summarized as lack of physical and economic access to food required by all for safe, active and healthy living. Food insecurity exists when people lack sustainable physical and/or economic access to enough, safe, nutritious and socially acceptable food for healthy and productive life. Helen (2002) asserted that food is useful for maintaining political stability and ensuring peace among people while food insecurity can result in poor health and reduced performance of children.
Shala and Stacey (2001) contended that many countries experience food insecurity with food supplies that are inadequate to maintain their citizens’ per capita consumption. One of the underline causes of food insecurity in developing countries is surge in population. Cargill (2014) posited that feeding this growing global population in the coming years will require production of more food and distribution of the same in a manner that ensures that it reaches more people which has been lacking in Nigeria and many other countries particularly the developing ones without resources for food production and distribution. Mwaniki (2006) while underscoring food insecurity risks also contended that the root cause of food insecurity in developing countries in some cases is not complete absence of food but inability of people to gain access to food due to persisting poverty which has reduced their purchasing power.
Therefore, this study has defined the underlining factors that predispose households to food insecurity as risks. Therefore, the objectives of this paper are to identify the food insecurity risks among households in in the study area, classify the households based on those risks based on perception of household heads or other appointed representatives of the household familiar with the food supplies to the households and its consumption and the management strategies employed by such households to mitigate the effects of food insecurity. Also, the study investigated those factors that influenced the presence or otherwise of food insecurity risks among households in the study area.
While it is unarguable that so many works have been done regarding food security and food insecurity by many researchers. It is equally understandable that many studies have been carried out on risks perception and management strategies in recent years. However not many of these studies have been carried out on food insecurity risks thereby necessitating this research with focus on food insecurity risks and the factors that expose households to such risks considering the contributions it will make to the body of knowledge and particularly the research works on rising food insecurity in developing nations particularly in Nigeria by working on the policy recommendations offered by this study.
1.1. Conceptual framework on food security in Nigeria in relation to the world
This study investigated the apparent risks to food security in households and the management practices employed by respective households to counter the consequences of such risks as perceived by the heads or other appointed representatives of various households. This study is expected to serve as tool and guidance for the implementation of the zero hunger targets of the SDGs being coordinated by United Nations by letting the stakeholders know the areas to which their intervention on food needs of the populace in terms of risk factors to food security should be directed by addressing them with more vigour and commitment. Just like other countries of the world today including those in the Mediterranean region, Nigeria has equally experienced good times in terms of food supplies that met the demand of the growing populace until the end of the 60s when these fortunes started to decline due to discovery of oil in commercial quantities (Fawole et al., 2016). Just like the Mediterranean region which food shortage started to manifest due to food crises of 2007/2008 as affirmed by Lacirignola et al. (2015), Nigerian food insecurity began to rise during this period basically due to some factors including continued neglect of agriculture, 2007/2008 food crisis and the start of boko haram insurgency which has left about 2.1 million people displaced with many agricultural livelihoods destroyed as at 2016 ending thereby resulting in high prices of foods thereby contributing to the problem of food insecurity in the country (FAO, 2017). According to the latest reports published by the Food and Agricultural Organization (FAO) of the United Nations, food insecurity in the world had risen from 777 million in 2015 to 815 million in 2016 (FAO, 2017). Lacirignola et al. (2015) attributed the continuous rise in food insecurity in the world to rise in demand which has been principally due to population growth which is expected to reach nine billion by 2050 thus making the prices of foods to soar in the world to which Nigeria and other African countries are not immune. The continuous rise in food insecurity in Nigeria has its attendant consequences on other countries of the world including the Mediterranean countries due to huge population of the country. For example, the developmental challenges such as poverty, unemployment, diseases, and hunger have forced many youths including young girls to unnecessary migration to other Mediterranean countries especially Italy and Spain where the youths are engaging in various nefarious activities which affects the economies and infrastructures of the destination countries.
Finally, it is pertinent to note that previous interventions related to food insecurity executed by various development organizations and NGOs have failed to achieve the desired results largely due to the fact that some of the organizations have always lacked the required skills in terms of risk analysis and appraisals of the causes of the problem which this study is trying to provide having recognized that the primary step to halt the debilitating effects of food insecurity is to study the risk factors in form of risks and work on its prevention rather than the outbreak.
1.2. Concept of risk perception and management strategies
Risk is a day to day incident that affects the achievement of set goals and is studied in various disciplines to serve as control measures for preventing negative consequences which in this case is food insecurity. Wu et al. (2011) posited that while some regions including China, Eastern Europe and southern American countries would witness increase in per capita food availability coupled with ability to import thereby sustaining their food security, other regions such as southern Asia and most African countries including Nigeria might likely remain hotspots for food insecurity due to decreasing per capita food availability and declining capacity to import foods. However, some advanced countries were projected to equally experience decreased per capita food availability but would remain food secure as a result of their higher income and purchasing power.
While it is true that many studies have been carried out on risks perception and management, it is not true that researchers agree on common definition for risks, as an example Damodaran (2007) described risk as an inherent part of human life while Aven and Renn (2009) looked at risk from two different points of view; (i.) a situation whereby something that humans value is at stake including humans themselves and (ii.) an uncertain consequence of an event or activity that humans value. They combined these two definitions as meaning uncertainty of an event or activity and its consequence. Also, Willis (2007) viewed risks as an expected loss of an action or event just as Campbell (2005) saw it as expected disutility (dissatisfaction) from an event or activity. Lowrance (1976) cited in Aven and Renn (2009) saw it in negative perspective and thus defined risk as measure of probability and severity of adverse effects of activity or occurrence.
Furthermore, Kaplan (1991) viewed it as a set of occurrences with both probability and consequence. However, attempts were made by Legesse and Drake (2005) to define risk in terms of consequences of human action and natural events. It is also noteworthy that while Aven and Renn (2009), Douglas and Wildavsky (1982) and Beck (1992) saw risk and risk perception as one and same, Bishu et al. (2016) saw them as different by defining risk as decision maker’s interpretation of the content of the risks and risk perception as subjective measure of risk. They also saw inappropriate risk aversion strategies and inadequate risk management responses as underline causes of poverty especially in rural areas. Slovic (1987) viewed risk perception as opinions of people when asked about possible threats to a course of action. As important as risk perception to the studies involving risk analysis, achieving a universal definition for it is not an easy task (Ahsan, 2011). Apart from the controversies surrounding the risks perception, there are several ways by which these risks effects or consequences are mitigated or managed. However, due to economic and social constraints, management of risks has always been a herculean task for people to manage especially the less privileged who might not be in possession of required resources to achieve this (Bishu et al., 2016). Consequently, this study aims to investigate what the consequences of food insecurity risks are in the households as perceived by the heads or appointed representatives who gave information on food insecurity risks perception among the households in the study area.
2. Materials and methods
2.1. Description of the study area
This study was conducted in south western Nigeria comprising six of the thirty-six states of the entire federation and federal capital territory. However, two states of Osun and Oyo were used as the representative samples for all the six states in South Western Nigeria considering their peculiarity in terms of culture, tradition and types of foods being consumed among households in addition to time and resources constraints for this study. According to 2006 population census results, Osun had a population of 3.4 million with 30 local governments (Osun, 2017) while Oyo had 4.5 million people with 33 local governments (Osun, 2017) though the populations of the two states are more now. Osun covers approximately 14,875 square kilometer in land area and lies between latitude 7°30’N and longitude 4°30’E and Oyo covers a total of 27,249 square kilometers of land mass and lying between latitudes 6°45’N – 7°15’N. The administrative capital city for Osun state is Osogbo and for Oyo is Ibadan, the second largest city in southern Sahara (Oyo, 2017 and Osun, 2017).
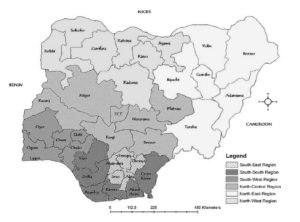
Figure 1 – Nigerian map by states location.
Source: Ekong et al. (2012).
2.2. Data for the study
Primary data collected with the aid of structured questionnaires were used for this study and the unit of study was the household from where data on food supplies and consumption by the households were collected for the purpose of investigating the risks associated with food security in the study area. Data were collected from various households by interviewing the households’ heads and those responsible for procurement and cooking of foods for the entire households especially women.
Multistage sampling techniques involving three stages were used for this study. First stage involved purposive selection of two states of Oyo and Osun from the south west region of the country. Second stage was the random selection of nine local government areas from the two states (with five from Oyo and four from Osun) according to their population proportion. For this, five local governments of Ibadan North East, Saki West, Surulere, Oyo East and Ibarapa East were selected with one local government each from the 5 zones of Oyo State and for Osun, four local governments of Osogbo, Obokun, Ayedaade and Ife East were selected with at least one from each of the 3 districts of Osun State except two from Osun East due to large population size. The third and the last stage was random sampling of about 200 households from the selected towns and villages from the respective local government areas earlier selected (Muche et al., 2014 and Mitiku et al., 2013).
2.3. Method of data analysis
About 200 questionnaires were administered to the sampled households from which 39 were discarded due to incomplete information and the remaining 161 were used for the analysis (Osun: 76, Oyo: 85). Both descriptive statistics and econometrics methods were used to analyse the collected data for this study. For econometric analysis, logistic regression was used to investigate those factors that influence the presence/absence of food insecurity risks in the households in the study area.
Descriptive statistics (minimum, maximum and mean values) were used to classify the households according to the number of food insecurity risks manifesting in the households. To achieve this, household heads or other appointed representatives were presented with six food insecurity risks from which they were requested to select food insecurity risks that were peculiar to their respective households as shown below;
Which of the following food insecurity risks is/are applicable to your households?
Risk 1: ood shortages prior to harvest/crop failure [ ]
Risk 2: astage due to inadequate storage facilities [ ]
Risk 3: easonal/unforeseen food shortages [ ]
Risk 4: xceptional price hikes [ ]
Risk 5: ow production/yield level [ ]
Risk 6: ack of cash to buy food [ ]
2.4. Risks management strategies employed by households
As in the case of food insecurity risks, descriptive statistics was used to classify the households according to risks management strategies employed by respective households. Apart from classifying the households based on the risk management strategies being used, the households were also grouped according to the level of the risks management used. Based on this, the level of adopting risks management strategies was categorized into three; minimal (1–3 risks management strategies), medium/moderate (4–6 risks management strategies) and severe (7–9 risks management strategies). To derive this, the household heads or appointed representatives were presented with the following nine questions and were requested to tick appropriately those that were applicable to their respective households.
Which of the following strategies do you adopt to manage food insecurity risks as stated in question one (if any) in your household in the last one month?
Strategy 1: onsumption of less preferred foods,
Strategy 2:
Reduction of the quantity of foods served to the adults in the household,
Strategy 3:
Reduction of foods served to the adults because of children,
Strategy 4: eduction of foods served to the children,
Strategy 5: kipping of meals,
Strategy 6: ot eating for a whole day,
Strategy 7:
Borrowing money to buy foods for the households,
Strategy 8: urchasing foods on credit,
Strategy 9:
Rationed money to household members to buy street foods from vendors.
This study also investigated those factors that influence the presence or absence of food insecurity risks in the households in the study area. To achieve this binary logistic regression model as specified shortly was used.
2.5. The Model
To identify those factors that influence the presence or absence of food insecurity risks in the households, a binary logistic model was specified by grouping the households based on probability of showing food insecurity risks or otherwise according to the response of the household heads to the questions asked. Those households that showed at least one food insecurity risk as outlined in the questionnaire were marked as 1 and 0 for otherwise apart from price hike that was peculiar to almost all the households investigated (Babatunde et al., 2007; Obayelu, 2012).
2.5.1. Specification of the model
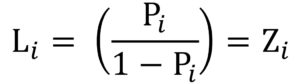 (1)
(1)
Where i = 1, 2, 3, …, n (n = 8)
From the general model as specified in equation (1) above,
Zi = β0 + βi Xi + µi (2)
Where i = 1, 2, 3… 8 in this case. The equation (1) above can this be rewritten as follows;
β0 + β1X1+ β2X2+β3X3+ β4X4
+ β5X5+ β6X6 + β7X7+ β8X8 + µi (3)
Where,
Dependent variable = food insecurity risks (presence = 1, otherwise = 0),
X1 = educational status of household head (number of years spent in school),
X2 = household size (total number of members in the household eating from the same source),
X3 = food market distance from households (in kilometres),
X4 = Unemployed members of the households (number),
X5 = age of the household head,
X6 = cooperative membership status of the household head (member = 1, non-member = 0),
X7 = total household monthly income (in naira),
X8 = state of location of the household (Osun = 1, Oyo = 0),
µi = error term.
Again, the above procedures were repeated for the purpose of investigating the drivers of each of the food insecurity risk in households the results of which are as shown in the results section on Table 8 and 9.
Parameters (βs) of the explanatory variables as specified were estimated through Maximum Likelihood Estimates (MLE) by using STATA 10.0 statistical software.
Pi = Probability of presence of food insecurity risks in the household,
1 – Pi = Probability of otherwise.
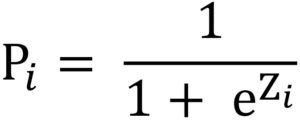 (4)
(4)
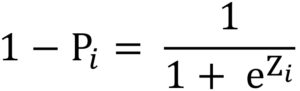 (5)
(5)
Zi = Li as stated in equation (1) above while Zi = β0 + βiXi as explicitly stated in equation (3).
Finally, z-statistics was used to test the statistical significance levels of the estimated coefficients of the explanatory variables. For the goodness of fits of the model, this study used pseudo R2, Count R2 and Hosmer-Lemeshow chi squared value as shown in the results section. Count R2 was estimated as follows;
![]() (6)
(6)
Food insecurity risk is present = 1, Food insecurity risk is absent = 0.
Therefore there are correct predictions when there is food insecurity risk in a household with the estimated logit greater than or equal to 0.5 and when there is no food insecurity risk with the estimated logit less than 0.5. The mathematical expressions of the above are as follows;
Li ≥ 0.5 = 1 and Li < 0.5 = 0 ≈ correct predictions,
Li = estimated logit from equation (1),
(Gujarati and Porter, 2009 and Abbas et al., 2017).
This study used Pearson Correlation Coefficient to estimate the existing relationship between food insecurity risks and management strategies adopted by households.
![]() (7)
(7)
Cov (FoodRisks, MgtStrat.) = sample covariance of food insecurity risks and management strategies,
Var (FoodRisks) = sample covariance of food insecurity risks,
Var (MgtStrat.) = sample covariance of management strategies,
r = Pearson Correlation Coefficient.
3. Results and discussions
3.1. Results
According to the analysis of the collected data, the major findings showed that the majority (141 households) of the households representing 87.6 percent showed one form of food insecurity risks or the other while the remaining households (12.4 percent) did not show any incidence of food insecurity risk as shown on Table 1 subsequently. Similarly, according to the results as presented on Table 4, 64 percent of the households used strategy 1 (Consumption of less preferred foods) to mitigate the effects of food insecurity risks in their respective households.
3.2. Discussions
3.2.1. Food insecurity risks based on perception
The results as presented on Table 2 show that risk 4 (Exceptional price hikes) was the most prevalence form of food insecurity risks as perceived by household heads in the study area with 95 percent of the households showing it followed by risk 6 (Lack of cash to buy food) experienced by 117 households representing 72.2 percent. However, the least form of food insecurity risk was risk 5 (Low production/yield level) experienced by 26.1 percent of the households which was mainly experienced by households that got parts of their food supplies from family farms.
Table 1 – Food insecurity risks.
|
Risk status |
Number |
Percentage |
|
With risk |
141 |
87.6 |
|
Without risk |
20 |
12.4 |
|
Total |
161 |
100 |
Computed from field survey, 2016.
Table 2 – Types of food insecurity risks perceived in households.
|
Risk type |
Number |
Percentage |
|
Risk 1 |
59 |
36.6 |
|
Risk 2 |
53 |
32.9 |
|
Risk 3 |
100 |
62.1 |
|
Risk 4 |
153 |
95.0 |
|
Risk 5 |
42 |
26.1 |
|
Risk 6 |
117 |
72.7 |
Computed from field survey, 2016.
3.2.2. Food insecurity risks according to level and severity
The results of the classification of the households according to the level of food insecurity risks as noted in the responses of the households’ heads or appointed representatives to the questions asked on food insecurity risks perception are as presented on Table 3. The findings of the study indicate that severe food insecurity risks level constitute the majority of households showing between 4 and 6 food insecurity risks followed by both medium (3 food insecurity risks) and low (0 and 2 food insecurity risks) which were equally shared constituting 28 percent each of the entire households investigated.
Table 3 – Level and severity of food insecurity risks in the households.
|
Risk level |
Number |
Percentage |
|
Low (0–2) |
45 |
28.0 |
|
Medium (3) |
45 |
28.0 |
|
Severe (4–6) |
71 |
44.0 |
|
Total |
161 |
100 |
Computed from field survey, 2016.
Following the same pattern used in the analysis of food insecurity risks perception as, the same method was used to analyze the management strategies employed by households to cushion the effects of food insecurity risks in the households. In all, 9 management strategies as listed in the section 2 were presented to the household heads or appointed representatives. The results according to their responses are as presented on Table 4 and show that strategy 1 (Consumption of less preferred foods) was the most utilized form of management strategies and was used by 64 percent of the households followed by strategy 2 (Reduction of the quantity of foods served to the adults in the households) which was used by 49.7 percent of the households.3.2.3. Food insecurity risk management strategies
Table 4 – Risks management strategies utilized by households.
|
Management strategies |
Number of households |
Percentage |
|
Strategy 1 |
103 |
64.0 |
|
Strategy 2 |
80 |
49.7 |
|
Strategy 3 |
73 |
45.3 |
|
Strategy 4 |
43 |
26.7 |
|
Strategy 5 |
51 |
31.7 |
|
Strategy 6 |
15 |
9.3 |
|
Strategy 7 |
52 |
32.3 |
|
Strategy 8 |
55 |
34.2 |
|
Strategy 9 |
35 |
21.7 |
Computed from field survey, 2016.
However, strategy 6 (Not eating for a whole day) which was seen as the most debilitating strategy was being employed by some households due to prevailing economic situation in the country as of the time of this survey and the households using this strategy accounted for 9.3 percent. Though quite a low percentage compared with other strategies, it is still unacceptable because of the effects of this on the dignity and psychology of the affected people. The policy implication of this is that the food insecurity in the study area is critical and endemic going by the number of households that were employing this form of strategy to cushion the effects of food insecurity risks in their respective households.
Table 5 – Level of food insecurity risks management strategies utilized by households.
|
Risk management strategy level |
Number of households |
Percentage |
|
Minimal (0–3) |
85 |
52.8 |
|
Medium/moderate (4–6) |
68 |
42.2 |
|
Severe (7–9) |
8 |
5.0 |
|
Total |
161 |
100 |
Computed from field survey, 2016.
3.2.4. Level of food risk management strategies
Following the same categorization patterns as in the food insecurity risks level, the number of management strategies employed to cushion the effects of food insecurity risks are as presented on Table 5 subsequently. The results show that households with minimal risk management strategies (between 0 and 3 management strategies) constituted majority (52.8 percent) followed by medium/moderate (between 4 and 6 management strategies) management strategies which constituted 42.2 percent. Those who employed severe management strategies (between 7 and 9 management strategies) constituted the lowest level of management strategies. These findings implied that households in the study area are susceptible to food insecurity considering the level of management strategies adopted due to high prevalence of food insecurity risks in their households.
3.2.5. Descriptive statistics of the risk perception, management strategies and socioeconomic characteristics
The results of the study according to the descriptive statistics of the variables are as shown on Table 6 subsequently. The results show that the mean of the risk perception and management strategies were 3.25 and 3.15 respectively. Also, the educational status and the age of the household heads were 12.16 and 48.4 years respectively. The average household size and total monthly income of the households were 5.2 and ₦ 49754.28 respectively.
Table 6 – Descriptive statistics of food insecurity risks and adopted management strategies.
|
Variable |
N |
Min |
Max |
Mean |
Std. deviation |
|
Risks perceptions |
161 |
0 |
6 |
3.25 |
1.42 |
|
Risks management strategies |
161 |
0 |
9 |
3.15 |
2.68 |
|
Education status of H/head |
161 |
0 |
20 |
12.16 |
5.59 |
|
Household size |
161 |
2 |
13 |
5.16 |
1.97 |
|
Age of household head |
161 |
27 |
82 |
48.37 |
11.13 |
|
Total monthly income of H/head |
161 |
10000 |
675000 |
49754.28 |
66973.11 |
Computed from field survey, 2016.
3.3. Factors influencing the presence/absence of food insecurity risks
Following the logistic model as specified in the method section, the results of the analysis of the data from the survey are as summarized in the equation (8) below;
 -1.198 – 0.021educ + 0.742Size + 1.482Foodmkt + 0.228Unemployed – 0.029Age – 0.035Cooperative – 8e-06Income – 1.504Location (8)
3.4. Interpretation of logistic regression analysis results
From the results of the analysis of the logistic model as presented on Table 7, five of the eight explanatory variables as specified in the model significantly influenced the manifestation of food insecurity risks in the households. The results show that the household size had positive and significant (p < 0.01) relationship with food insecurity risks perception by the households which is consistent with a priori expectation. These findings imply that when the household size increased by 1 member, the odds in favour of household showing one form of food insecurity risks also increased by 2.1. In other word, when the household size increased by a member, the probability of households manifesting food insecurity risks also increased by 0.04. Similarly, food market distance from households showed positive and significant (p < 0.05) relationship with food insecurity risks perception in line with a priori expectation. These findings imply that when the distance of food market from the household increased by a kilometer, the odds in favour of food insecurity risks perception by households also increased by 4.4. In other word, when the distance of the food market from the household increased by a kilometer, the probability of perceiving food insecurity risks was 0.13. On its own, the number of unemployed members of the households showed positive and significant (p < 0.1) relationship with food insecurity risks perception in the household which concurs with the expectation. The results showed that when the number of unemployed members in the household increased by a member, the odds in favour of households manifesting food insecurity risks also increased by 1.26. In other word, when the number of unemployed members in the household increase by a member, the probability of perceiving food insecurity risks by the household also increased by 0.01. Furthermore, the total household monthly income showed negative and significant (p < 0.05) relationship with food insecurity risks perception by the households. The results show that when the total household monthly income increased by one Naira (Nigerian currency), the odds in favour of manifesting food insecurity risks by household decreased by a unity. In other word, when the total household monthly income increased by one Naira (Nigerian currency), the probability of manifesting food insecurity risks by household decreased by 4.2e-07. Finally, the location of the household (Osun or Oyo) showed negative and significant (p < 0.05) relationship with food insecurity risks perception by the households. The results show that when the household is located in Osun, the perception of food insecurity risks by households decreased by 0.22 compared with household located in Oyo. These findings imply that food insecurity in Oyo is more prevalent going by the manifestation of associated risks. In other word, when the household is located in Osun, the probability of perceiving food insecurity risks by the household decreased by 0.09 compared with household located in Oyo.
Table 7- Logistic regression analysis results showing the determinants of food insecurity risks sources manifestation in the households.
|
Variables |
Coefficient |
SE |
Z – stat |
p > |z| |
Odds ratio |
ME |
|
Constant |
-1.1980 |
1.9680 |
-0.10 |
0.920 |
– |
– |
|
Educational status of household head (years) |
-0.0214 |
0.0625 |
-0.34 |
0.732 |
0.9788 |
-0.0011 |
|
Household size (number of members) |
0.7417*** |
0.2427 |
3.06 |
0.002 |
2.0994 |
0.0388 |
|
Food market distance from households (km) |
1.4816** |
0.6555 |
2.26 |
0.024 |
4.4001 |
0.1265 |
|
Unemployed members (number) |
0.2282* |
0.1167 |
1.96 |
0.051 |
1.2563 |
0.0119 |
|
Age of the household head (years) |
-0.0286 |
0.0260 |
-1.10 |
0.270 |
0.9718 |
-0.0015 |
|
+Cooperative membership (member =1, non-member=0) |
-0.0348 |
0.5639 |
-0.06 |
0.951 |
0.9658 |
-0.0018 |
|
Total household income (₦) |
-8e-06** |
4e-06 |
-2.03 |
0.042 |
0.9999 |
-4.2e-07 |
|
+State of location of household (Osun=1, Oyo=0) |
-1.5043** |
0.6346 |
-2.37 |
0.018 |
0.2222 |
-0.0868 |
|
Log likelihood |
-44.66 |
Number of observations |
161 |
|||
|
LR chi2 (8) |
35.35 |
Mean marginal effects |
0.945 |
|||
|
Hosmer-Lemeshow chi2 (8) |
8.36 |
Prob > chi2 (p-value) |
0.0000 |
|||
|
Percentage of correct predictions |
91.3 |
Pseudo R2 |
0.2836 |
|||
|
Note: SE: Standard Error; ME: Marginal effects |
||||||
|
(+) represents dummy variables (0 or 1); Dependent variable: Food insecurity risk perception; |
||||||
|
***, **, * are statistical significance at 1%, 5%, and 10% levels respectively. |
Source: Computation of the logistic regression analysis from field survey, 2016.
Table 8 – Distribution of households according to the effects of explanatory variables on manifestation of each food insecurity risks.
|
Explanatory variables |
Risk 1 |
Risk 2 |
Risk 3 |
|||
|
Coefficient |
p > |z| |
Coefficient |
p > |z| |
Coefficient |
p > |z| |
|
|
Constant |
-3.5528 |
0.01 |
0.0351 |
0.98 |
1.6166 |
0.23 |
|
Educational status of household head (years) |
0.0249 |
0.5200 |
-0.0500 |
0.19 |
-0.0049 |
0.90 |
|
Household size (number of members) |
0.0570 |
0.610 |
0.1592 |
0.17 |
0.0065 |
0.95 |
|
Food market distance from households (km) |
0.0929 |
0.86 |
-0.5333 |
0.29 |
0.1135 |
0.82 |
|
Unemployed members (number) |
0.1184* |
0.09 |
-0.0110 |
0.88 |
0.0387 |
0.57 |
|
Age of the household head (years) |
0.0348** |
0.05 |
-0.0048 |
0.80 |
-0.0040 |
0.82 |
|
+Cooperative membership (member=1, otherwise=0) |
1.2732*** |
0.00 |
1.036*** |
0.01 |
0.3151 |
0.39 |
|
Total household income (₦) |
-8.2E-06 |
0.18 |
-0.00001* |
0.10 |
-0.00001 |
0.02** |
|
+State of location of household (Osun=1, Oyo=0) |
-0.0006 |
1.00 |
-0.5344 |
0.16 |
-1.0973 |
0.00 |
|
(+) represents dummy variables (1 or 0). Dependent variable: Food insecurity risk perception; ***, **, * are statistical significance at 1%, 5%, and 10% levels respectively. |
Source: Computation of the logistic regression analysis from field survey, 2016.
3.5. Tests of goodness of fit of the model as specified
The results as presented on Table 7 reveal that eight explanatory variables as specified in the model had marginal effects on the food insecurity risks perception by households’ heads or other appointed representatives of the households going by the p–value which is significant (p < 0.001) at 0.01 thus the null hypothesis that the explanatory variables do not have marginal effects on the food insecurity risks perception in the households were rejected. The pseudo R2 value of 0.2836 suggests that the specified model fits into the data well (McFadden, 1974). Also, we tested for the multicollinearity among the explanatory variables with mean Variable Inflation Factor (VIF) of 1.18 and the least tolerance level of 0.67 confirming the absence of the multicollinearity among the explanatory variables. The Hosmer-Lemeshow chi2 (8) also stood at 8.36 which is in conformity with Kuwenyi et al. (2014).
3.6. Effects of explanatory variables on presence/absence of each food insecurity risk
This study also investigated the influence of the eight explanatory variables specified in the logistic regression model on the presence or absence each food insecurity risk the results of which are presented on Tables 8 and 9. The findings reveal that three, two, one, three, two and one of the eight explanatory variables significantly influenced the presence or absence of food insecurity risks 1, 2, 3, 4, 5 and 6 respectively.
3.7. Correlation between food insecurity risks and management strategies in households
The findings of the existing relationship between food insecurity risks and management strategies adopted by households are presented on Table 10 and reveal that the two variables (food insecurity risks and management strategies) had positive and strong relationship with each other which is in line with a priori expectation that whenever there was increase in the number of food insecurity risks in a particular household, there was corresponding increase in the number of management strategies adopted by such household to combat the effects of the risks on its members.
Table 9 – Distribution of households according to the effects of explanatory variables on manifestation of each food insecurity risks.
|
Explanatory variables |
Risk 4 |
Risk 5 |
Risk 6 |
|||
|
Coefficient |
p > |z| |
Coefficient |
p > |z| |
Coefficient |
p > |z| |
|
|
Constant |
-0.6372 |
0.81 |
-3.2248 |
0.03 |
-0.5843 |
0.69 |
|
Educational status of household head (years) |
0.1132 |
0.15 |
0.0507 |
0.22 |
0.0127 |
0.38 |
|
Household size (number of members) |
0.4566* |
0.09 |
0.2454** |
0.04 |
0.1148 |
0.38 |
|
Food market distance from households (km) |
1.3862 |
0.11 |
0.0395 |
0.94 |
0.1484 |
0.79 |
|
Unemployed members |
0.3131* |
0.07 |
0.1054 |
0.15 |
0.3508*** |
0.00 |
|
Age of the household head (years) |
-0.0178 |
0.58 |
-0.0156 |
0.43 |
0.0111 |
0.58 |
|
+Cooperative membership (member =1, otherwise=0) |
-1.5490* |
0.08 |
0.5067 |
0.19 |
-0.3364 |
0.41 |
|
Total household income (₦) |
0.00002 |
0.44 |
-1.2E-06 |
0.72 |
-4.9E-06 |
0.15 |
|
+State of location of household (Osun=1, Oyo=0) |
-0.951 |
0.30 |
0.9034** |
0.02 |
-0.6406 |
0.12 |
|
***, **, * are statistical significance at 1%, 5%, and 10% levels respectively. |
Source: Computation of the logistic regression analysis from field survey, 2016.
|
Management Strategies |
Food insecurity risks |
||
|
Management strategies |
Pearson Correlation |
1 |
0.580** |
|
Sig. (2 – tailed) |
– |
0.05 |
|
|
N |
161 |
161 |
|
|
Food insecurity risks |
Pearson Correlation |
0.580** |
1 |
|
Sig. (2 – tailed) |
0.05 |
– |
|
|
N |
161 |
161 |
** Correlation significant at the p < 0.05 (2 – tailed).
Table 10 – Results showing correlation between food insecurity risks and management strategies employed by households.
4. Conclusions and policy recommendations
Based on the findings of this study, it is evident that the persistent of food insecurity is glaring going by the number of food insecurity risks and the adopted management strategies by households in such situation. Majority of the households had shown risk 4 (Exceptional price hikes) and risk 6 (lack of cash to buy food) in that order while majority of the household resorted to strategy 1 (consumption of less preferred foods) and strategy 2 (reduction of the quantity of foods served to adults in the households) also in that order to mitigate the effects of food insecurity risks in the households. The findings have also shown that the size of the household, food market distance from the household, number of unemployed members of the households, total household income and the location of the household (Osun or Oyo) have shown significant relationship with food insecurity risks in various households at various levels. The policy implication of these is that the problem of food insecurity is still prevalence in the study area particularly with the alarming number of households that used debilitating management strategies such as strategy 5 (skipping of meals) and strategy 6 (not eating for a whole day) constituting 31.7 and 9.3 percent respectively. Lastly, the findings have cast aspersion on the achievement of zero hunger targets as being promoted by the United Nations based on high prevalence of food insecurity risks and the kinds of management strategies including the most debilitating ones being employed by the households. Therefore, to safe this situation, the policy recommendations as highlighted shortly should be strictly adhered to in order to achieve the zero hunger targets by 2030.
As stated earlier in the introductory parts of this paper, risk is a multidimensional concept with no agreed terms for definitions but rather seen from the perspective of various authors. Consequently, in managing food insecurity through interventions by various stakeholders, good understanding of the underlining causes in form of risks as manifested among households through rigorous analysis is recommended. Flaten et al. (2005) recommended study of risk perception as the first step in addressing the consequences of risks in a population. Therefore, based on the findings of this study efforts should be made by relevant stakeholders to address the problems of food insecurity by addressing its risk factors that predisposes households into it. There should be concerted efforts towards educating people on the importance of birth control that will see to minimize the number of people in the households to the manageable size according to the income coming into the households by embarking on campaigns to enable the adoption of family planning especially in the rural areas where such awareness is still low. Furthermore, government at all levels especially local governments should prioritize the marketing of agricultural products by ensuring that foods are available at reasonable distance to the households to help in reducing food insecurity in the households to ensure accessibility at reduced price. Efforts aimed at improving the income generation by households through sustainable livelihoods for people should also be considered because these findings have shown that the higher the number of unemployed in a given household the higher the incidence of food insecurity risks as well so also the income which showed inverse relationship with food insecurity risks. At this time that the economy is nose diving, it is imperative that policies that will improve the income of people must be considered alongside the encouragement of people to go into independent food production by households as a panacea to food insecurity in the study area and the country at large. Lastly, based on the location the government of Oyo state must equally encourage people to go into agriculture as in the case of Osun state while policies that will see to the reduction of costs of living such as enhanced transportation system in the metropolis must be given priorities to ensure food security in the study area. The states in the region should also compare notes on policies that aim to address the growing food insecurity in the region by collaborating in the area of agricultural policy that seeks to improve on food production in the region by making use of vast lands that remain fallow.
Declaration of interest statement
The authors of this article declare there is no conflict of interest and open to defending any contrary claims from any quarter.
References
Abbas T., Ali G., Adil S.A., Bashir M.K. and Kamran M.A., 2017. Economic analysis of biogas adoption technology by rural farmers: The case of Faisalabad district in Pakistan. Renewable Energy, 107: 431-439.
Ahsan D.A., 2011. Farmers’ Motivations, Risk Perceptions and Risk Management Strategies in a Developing Economy: Bangladesh Experience. Journal of Risk Research, 14(3): 325-349. DOI: 10.1080/13669877.2010.541558.
Aven T. and Renn O., 2009. On risk defined as an
event where the outcome is uncertain. Journal
of Risk Research, 12(1): 1-11. DOI: 10.1080/
13669870802488883.
Babatunde R.O., Omotesho O.A. and Sholatan O.S., 2007. Socio-economics Characteristics and Food Security Status of Farming Households in Kwara State, North Central Nigeria. Pakistan Journal of Nutrition, 6(1): 49-58.
Beck U., 1992. Risk society: Toward a new modernity, trans. M.A. Ritter. London: Sage Publications.
Bishu K.G., O’Reilly S., Lahiff E. and Steiner B., 2016. Cattle farmers’ perceptions of risk and risk management strategies: evidence from Northern Ethiopia. Journal of Risk Research, DOI: 10.1080/13669877.2016.1223163.
Campbell S., 2005. Determining overall risk. Journal of Risk Research, 8: 569-581.
Cargill, 2014. Food Security – The Challenges, Available at: http://www.cargill.com/wcm/groups/public/@ccom/documents/document/na3059573.pdf.
Ekong P.S., Ducheyne E., Carpenter T.E., Owolodun O.A., Oladokun A.T., Lombin L.H., and Berkvens D., 2012. Spatio-temporal epidemiology of highly pathogenic avian influenza (H5N1) outbreaks in Nigeria 2006-2008. Preventive Veterinary Medicine, 103(2-3): 170-177, available online at: http://www.sciencedirect.com/science/article/pii/S0167587711003084.
Damodaran A., 2007. Strategic Risk Taking: A Framework for Risk Management. New Jersey: Prentice Hall.
Douglas M. and Wildavsky A., 1982. Risk and culture: The selection of technological and environmental dangers. Berkeley, CA: University of California Press.
FAO, 2002. The State of Food Insecurity in the World 2001, Rome, available at: www.fao.org.
FAO, 2017. Global report on food crises 2017, available online at: http://www.fao.org/3/a-br323e.pdf, http://www.fao.org/emergencies/resources/documents/resources-detail/en/c/876564/.
Fawole W.O., Ozkan B. and Ayanrinde F.A., 2016. Measuring food security status among households in Osun State, Nigeria. British Food Journal, Vol. 118, No. 7, 1554-1567.
Flaten O., Lien G., Koesling M., Valle P.S. and Ebbesvik M., 2005. Comparing risk perceptions and risk management in organic and conventional dairy farming: empirical results from Norway, Livestock Production Science, 95(1): 11-25. DOI: 10.1016/j.livprodsci.2004.10.014.
Gujarati D.N. and Porter D.C., 2009. Basic Econometrics, 5th edition. New York: McGraw-Hill.
Helen H.J., 2002. Food Insecurity and the food stamp programme. American Journal of Agricultural Economics, Vol. 84, No. 95, 1215-1218.
Kaplan S., 1991. Risk assessment and risk management – basic concepts and terminology. Risk management: Expanding horizons in nuclear power and other industries. Boston, MA: Hemisphere Publ. Corp., 11-28.
Kuwenyi S., Kabuya F.I. and Masuku M.B., 2014. Determinants of Rural Households’ FoodSecurity in Shiselweni Region, Swaziland: Implications for Agricultural Policy. IOSR Journal of Agriculture and Veterinary Science (IOSR-JAVS), Vol. 7, Issue 11, Ver. III, 44-50.
Lacirignola C., Adinolfi F. and Capitanio F., 2015, Food security in the Mediterranean countries. New Medit, 14(4): 2-10.
Legesse B., and Drake L., 2005. Determinants of Smallholder Farmers’ Perceptions of Risk in the Eastern Highlands of Ethiopia, Journal of Risk Research, 8:5, 383-416.
Lowrance W., 1976. Of acceptable risk – science and the determination of safety. Los Altos, CA: William Kaufmann Inc.
McFadden D., 1974. “Conditional Logit analysis of qualitative choice behavior”. In: P. Zarembka (ed.), Frontiers in Econometrics. New York: Academic Press, 105-142.
Mitiku A., Fufa B. and Tadese B., 2012. Analysis of Factors Determining Households Food Security in Pastoral Area Oromia Region, Moyale District, in Ethiopia. International Journal of Agricultural Science, Research and Technology, 2(3): 105-110, available at: http://journals.iau.ir/article_517520_6a416b6674ddf60742bac6e7f10b6167.pdf.
Muche M., Endalew B. and Koricho T., 2014. Determinants of Household Food Security among Southwest Ethiopia Rural Households, Food Science and Technology, 2(7): 93-100.
Mwaniki A., 2006. Achieving Food Security in Africa: The Challenges and Issue, available at: http://www.food-security.nl/resource/achieving-food-security-africa-challenges-and-issues.
Obayelu A.E., 2012. “Households’ food security status and its determinants in the North-Central Nigeria”, Journal of Food Economics, 9(4): 241-256.
Shala A. and Stacey E., 2001. Food Security Assessment, Regional Overview Information Bulletin, United States Department of Agriculture: Economic Research Service, 2001.
Slovic P., 1987. Perception of Risk. Science, 236 (4799): 280-285, DOI: 0.1126/science.3563507.
Willis H.H., 2007. Guiding resource allocations based on terrorism risk. Risk Analysis, 27: 597-606.
Wu W., Yanga P., Tanga H., Youd L., Zhoua Q., Chena Z. and Shibasaki R., 2011. Global-scale assessment of potential future risks of food insecurity. Journal of Risk Research, 14(9): 1143-1160, DOI: 10.1080/13669877.2011.571794.